
Market Update February 20, 2026: Inflation Cools, Central Bank Signals Shift, and Markets Navigate Key Technical Levels
By CheckTheTrend Team
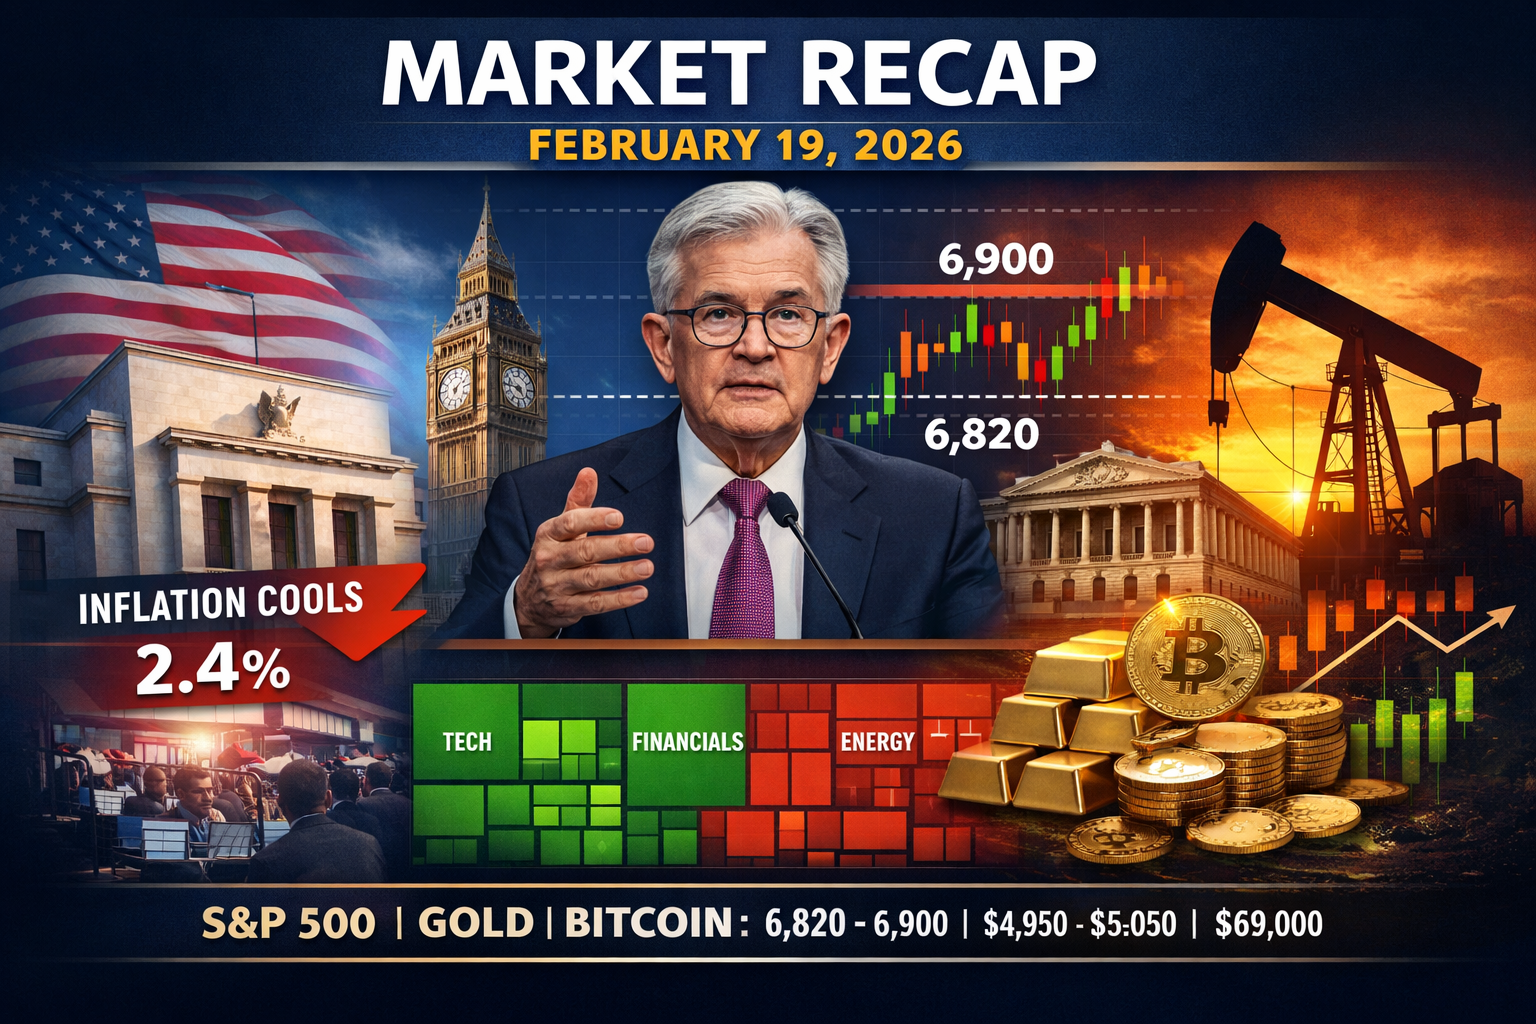
Market update February 19, 2026: CPI inflation cools to 2.4%, central banks signal potential policy shifts, and the S&P 500 tests key resistance. Full technical analysis, heatmap insights, and support & resistance levels.
Economic Data Releases Signal Cooling Inflation


4
Recent U.S. economic data revealed that consumer price inflation continues to moderate. The latest Consumer Price Index (CPI) rose just 0.2% in January, bringing annual inflation down to approximately 2.4% year-over-year. This reading came in below several forecasts and reinforces the narrative that inflationary pressures are gradually easing.
Slower headline inflation has strengthened expectations that central banks may maintain a more accommodative stance in the coming months. As bond yields soften in response, equity markets are reassessing valuations, particularly in growth-sensitive sectors.
Investors are now closely watching upcoming labor market releases and further inflation data for confirmation of the broader disinflation trend.
For real-time economic updates, traders continue to monitor the Forex Factory calendar:
👉 https://www.forexfactory.com/calendar
Central Bank Outlook: Fed and BoE in Focus


4
Monetary policy remains a dominant market driver as global central banks weigh inflation progress against labor market stability.
The Bank of England is facing growing expectations of a near-term rate cut after softer UK labor data. The FTSE 100 responded positively, reaching fresh highs as investors priced in a potential March policy adjustment.
Meanwhile, the Federal Reserve remains under intense scrutiny. With U.S. inflation cooling and signs of labor market moderation, markets are actively debating the timing of rate cuts. While no immediate policy shift is guaranteed, the tone of forward guidance has become increasingly important in shaping risk appetite.
Geopolitical Developments Keep Energy Markets Alert

4
Although macroeconomic data is currently dominating market sentiment, geopolitical tensions — particularly in energy-sensitive regions — continue to influence commodity prices.
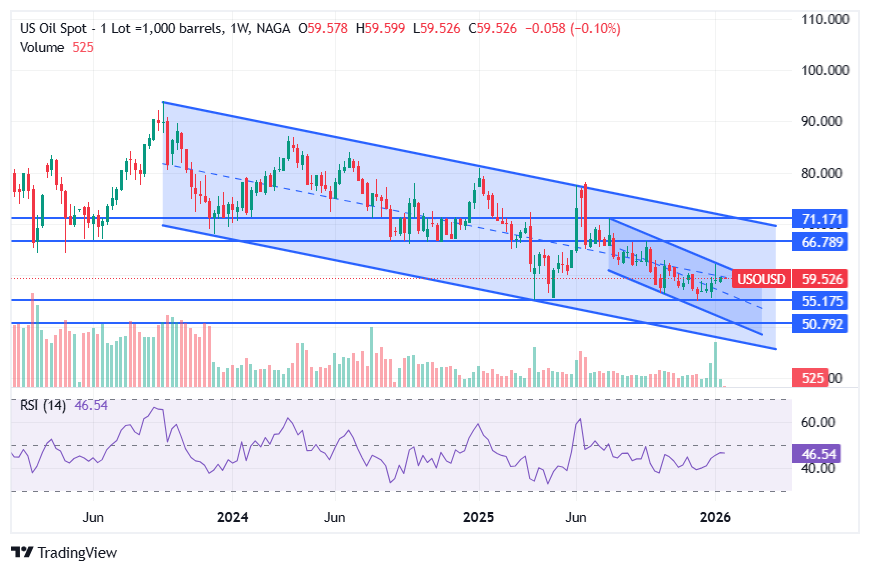
Oil markets remain supported by supply-side uncertainty, while safe-haven flows into gold persist during periods of global uncertainty. At this stage, geopolitical risks are contributing to volatility rather than triggering systemic disruption. However, traders remain alert to any escalation that could shift sentiment quickly.
Corporate Earnings Drive Sector Rotation


4
Corporate earnings continue to influence sector-specific trends. While the broader earnings cycle remains in transition, several mid-cap technology and semiconductor equipment firms have delivered resilient results.
Their performance has helped offset macro headwinds and provided pockets of strength within equity markets. Consumer discretionary and cyclical sectors have also demonstrated resilience, suggesting that investor confidence in underlying economic stability has not fully deteriorated.
Earnings surprises remain a catalyst for short-term volatility and sector rotation.
Sudden Market Movements Highlight Divergence
Recent trading sessions have shown increased dispersion across asset classes. Major indices have experienced mixed performance, with technology stocks facing valuation pressure even as energy and industrial names show strength.
Scanning data from Finviz reveals unusual volume activity in smaller-cap and growth stocks, suggesting that sector rotation is underway.
📊 Live Market Visuals
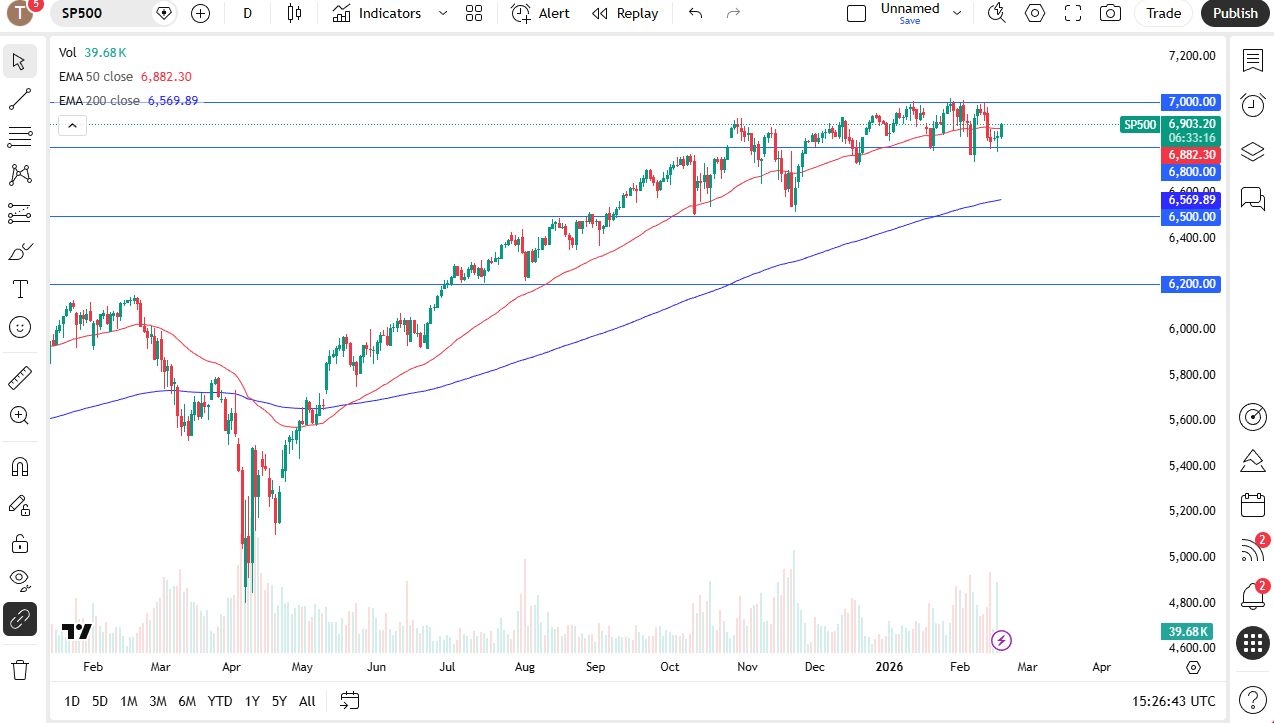
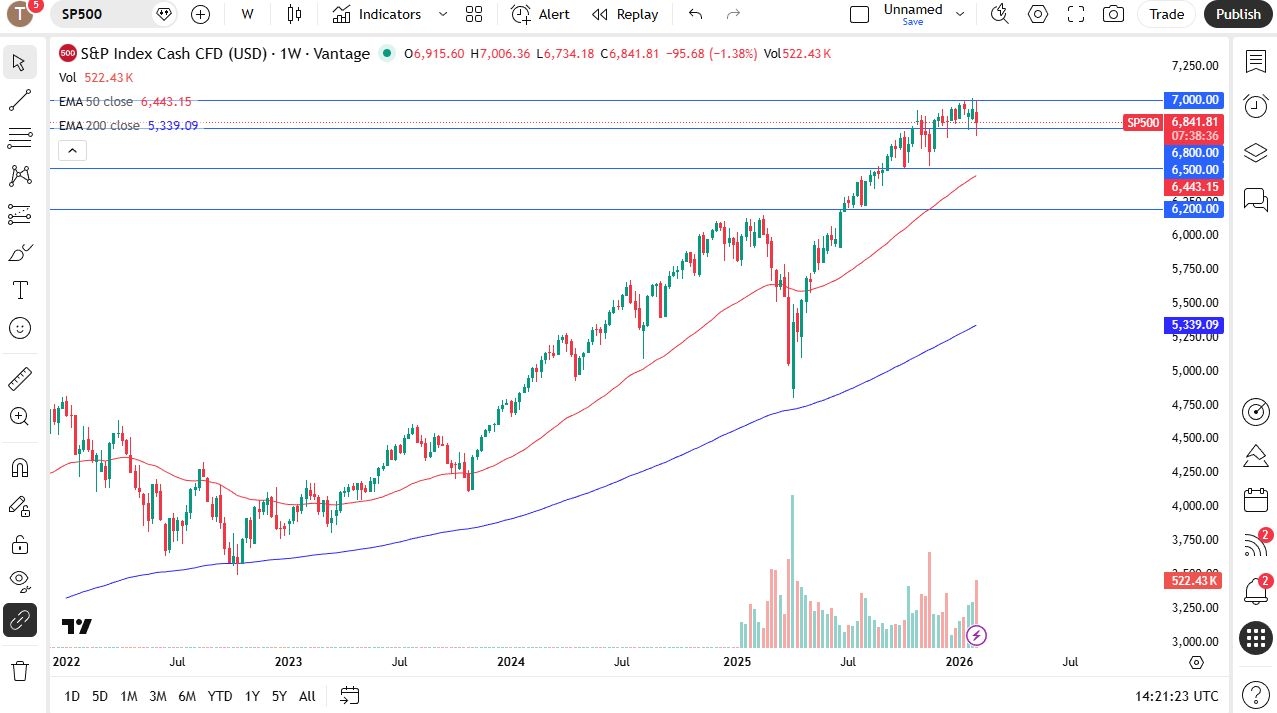
📈 S&P 500 Live Chart
4
Track live movements via TradingView:
👉 https://www.tradingview.com/symbols/SPX/
Price is consolidating near recent resistance levels after reacting to softer inflation data. The technical structure suggests compression before a potential breakout or rejection.
📊 Market Heatmap — Sector Performance
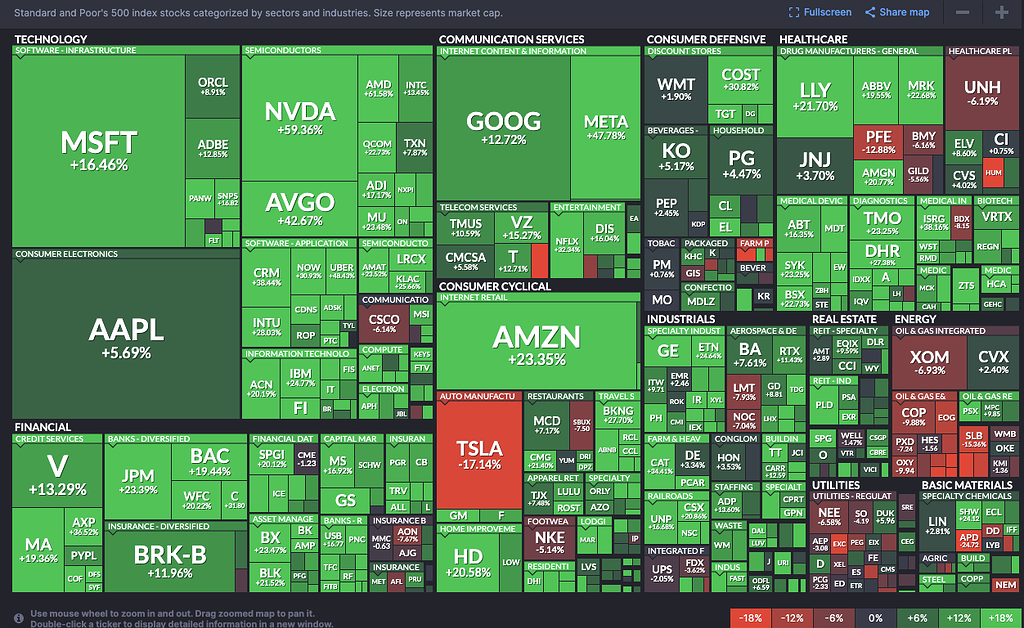

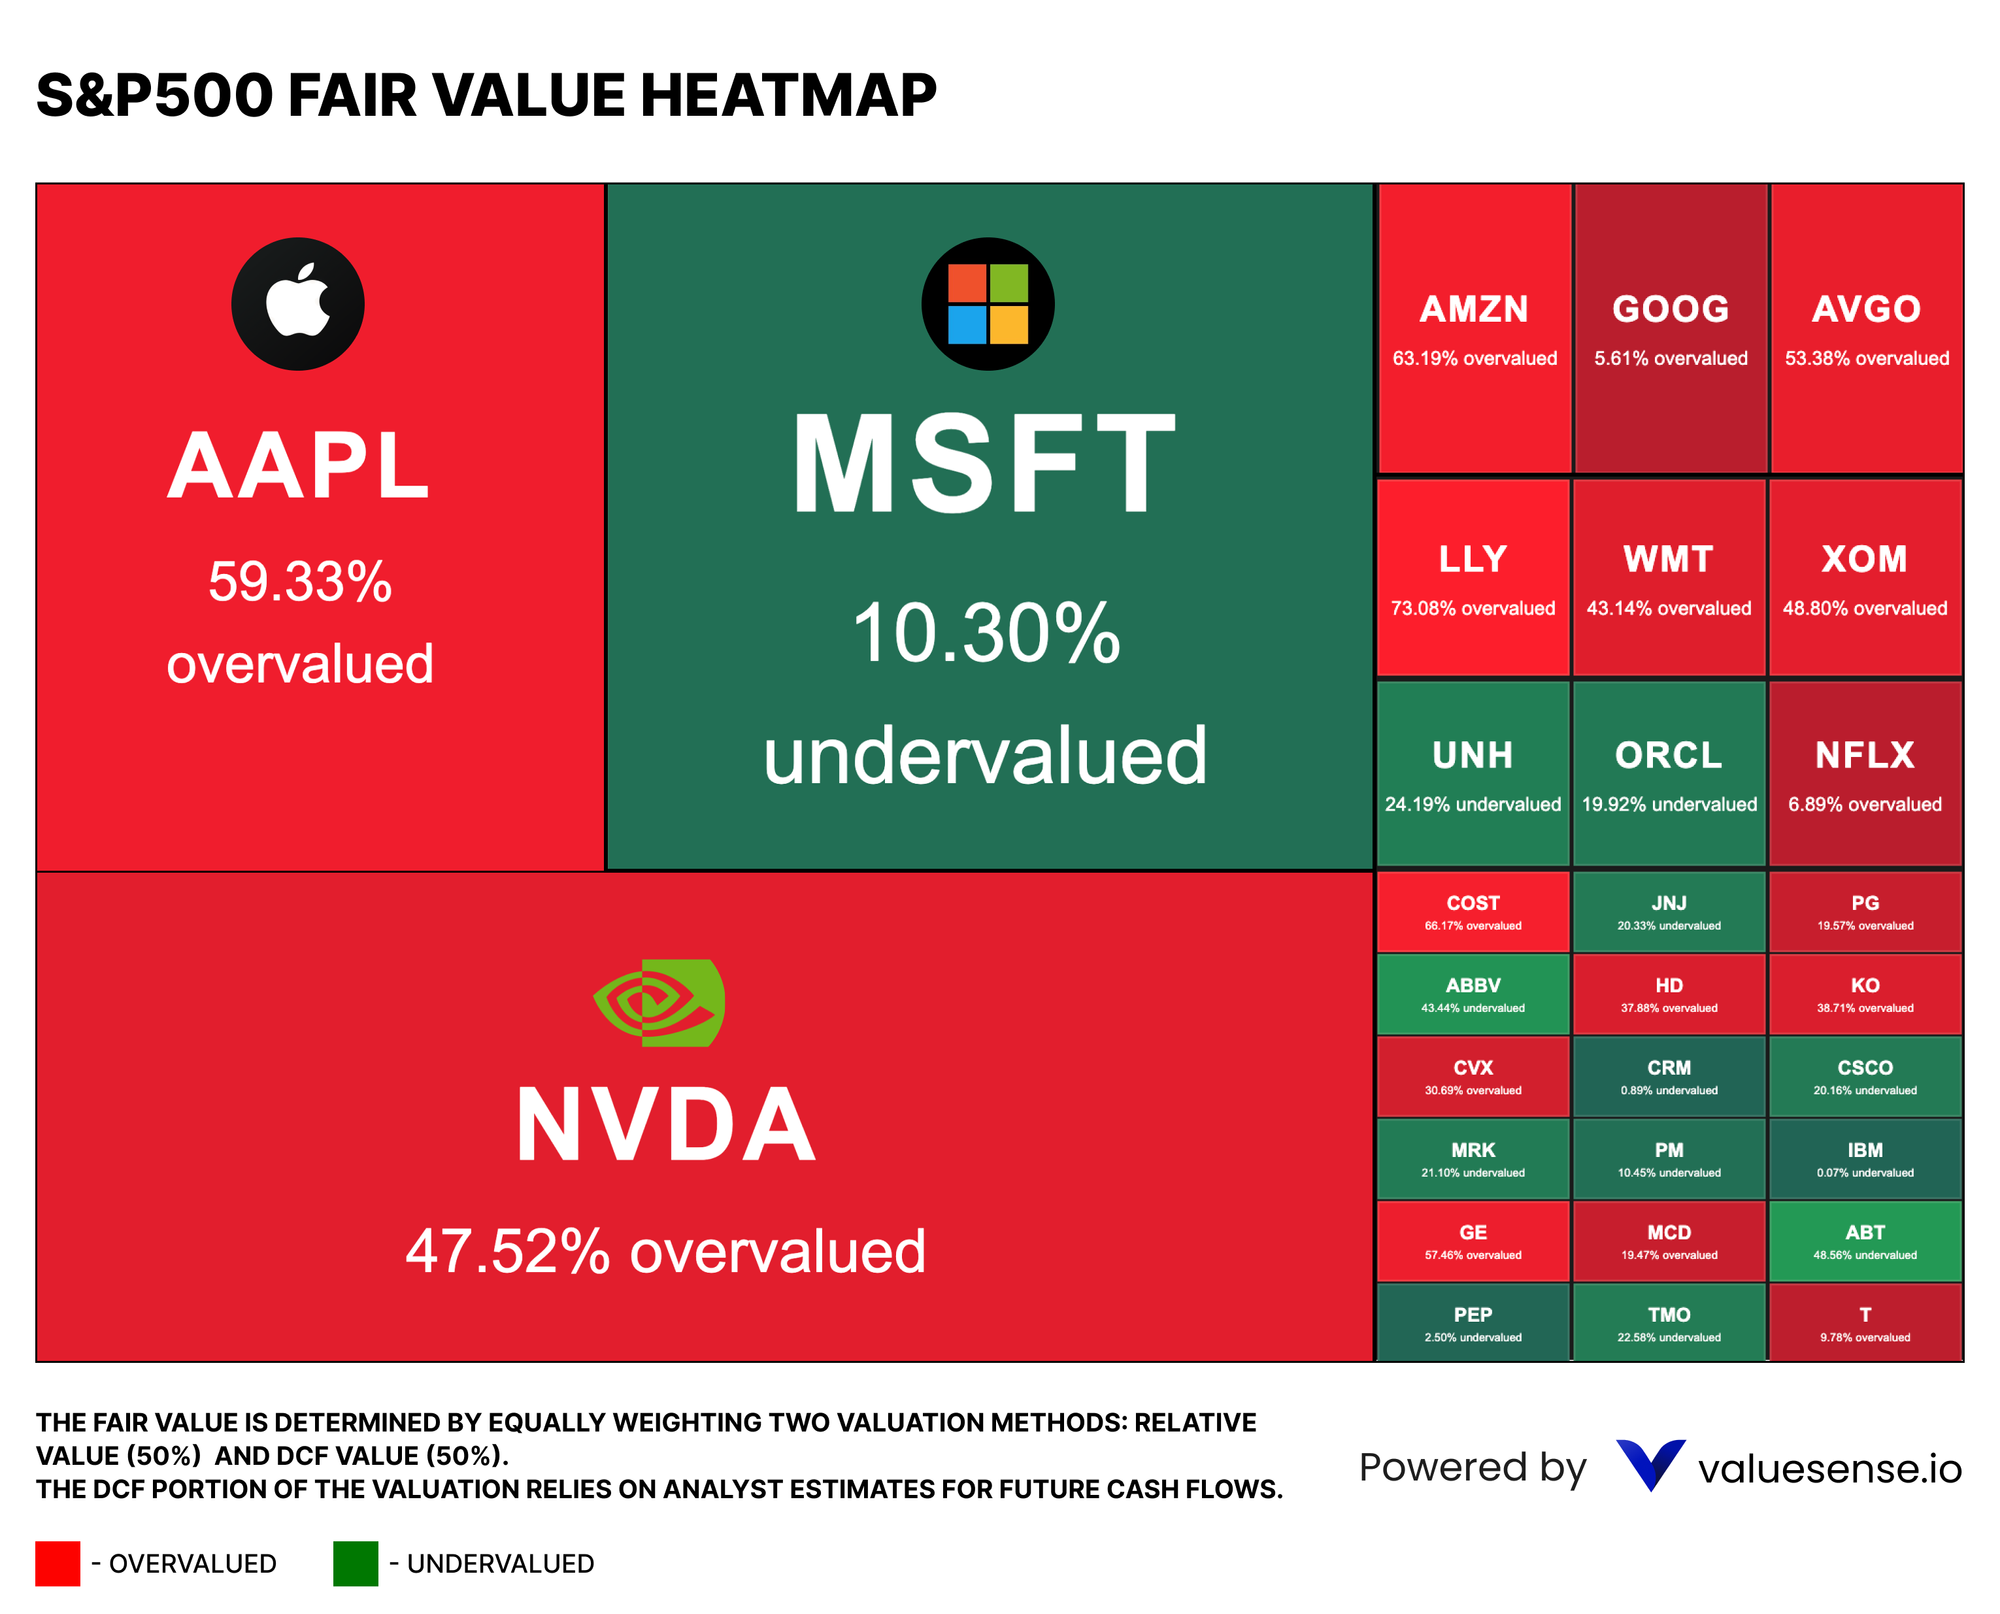
The heatmap highlights sector rotation, with green areas signaling strength and red zones indicating selling pressure. Financials and select industrial names are showing resilience, while parts of technology remain under pressure.
Technical Analysis: Key Levels to Watch
From a technical perspective, the S&P 500 and Dow Jones Industrial Average are hovering near important consolidation zones. Price action suggests short-term indecision, with neither bulls nor bears establishing clear dominance.
Support and Resistance Levels
| Asset | Support | Resistance |
|---|---|---|
| S&P 500 | 6,820 | 6,900 |
| Gold (XAU/USD) | $4,950 | $5,050 |
| Bitcoin | $66,000 | $69,000 |
These levels will likely determine near-term direction. A decisive break above resistance could trigger renewed upside momentum, while a breakdown below support may invite corrective pressure.
Market Forecast
Short-Term Outlook
Markets appear neutral to slightly bullish as traders digest inflation data and anticipate further labor reports. Consolidation near resistance is the most probable near-term scenario.
Medium-Term Outlook
If inflation continues trending lower and central banks provide clearer easing signals, risk appetite could strengthen. A confirmed breakout above resistance levels would validate bullish continuation patterns.
Long-Term Insight
Over the longer horizon, sustained disinflation combined with accommodative monetary policy may support equities, credit markets, and selective commodities. However, earnings growth and geopolitical stability will remain key determinants of trend durability.
Key Takeaways for Traders
- Inflation cooling continues to support dovish central bank expectations.
- Labor market data remains a primary volatility catalyst.
- Sector rotation is creating tactical trading opportunities.
- Technical levels will define the next major breakout or breakdown.
📈 Stay informed daily at CheckTheTrend.com — where macro insight meets technical precision.
Disclaimer: This article is for informational purposes only — it is not financial advice. Precious metals markets are volatile and influenced by many unpredictable global factors. Always consult a qualified financial professional before investing.
5 Reasons Why Gold and Silver Prices May Climb Higher in the Coming Weeks 13th Feb. 20026