

EIA Natural Gas Storage Report March 12, 2026: US Inventories Fall by 38 Bcf and What It Means for Energy Market
The EIA natural gas storage report March 12, 2026 revealed that U.S. natural gas inventories declined by 38 billion cubic feet (Bcf) during the latest reporting week. The EIA natural gas storage report March 12, 2026 shows US inventories declining by 38 Bcf. Discover what this means for natural gas prices, energy markets, and the global economy.
The report, released by the U.S. Energy Information Administration, provides one of the most important weekly indicators for energy traders, analysts, and investors who track developments in the global energy market.
People also Read:
Oil Shock Fears Rock Global Markets as Trump-Iran Crisis Escalates — Stocks, Gold and Forex React
Natural gas storage levels influence:
- energy prices
- electricity generation costs
- industrial production expenses
- global commodity markets
Because of this, the weekly storage report often triggers immediate reactions in financial markets, particularly in natural gas futures trading.
You can access the official report directly on the EIA website:
https://www.eia.gov/naturalgas/storage/
Understanding the EIA Natural Gas Storage Report
The EIA natural gas storage report March 12, 2026 measures the amount of natural gas stored in underground facilities across the United States.
These storage sites function as a buffer between:
- natural gas production
- seasonal consumption
During periods of low demand, natural gas is injected into storage facilities. When demand increases, especially during winter months or extreme weather conditions, gas is withdrawn from storage to meet consumption needs.
This balancing system helps stabilize the energy supply.
Energy traders and market analysts watch this data closely because it offers insights into the supply-demand balance within the U.S. natural gas market.
More energy statistics can be found at:
https://www.eia.gov
What a 38 Bcf Withdrawal Means
The 38 Bcf withdrawal reported in the EIA natural gas storage report March 12, 2026 indicates that natural gas consumption exceeded production and injections into storage during the week.
Withdrawals of this magnitude can occur when:
- colder weather increases heating demand
- electricity generation rises
- industrial energy usage increases
- liquefied natural gas exports grow
If withdrawals are larger than expected, natural gas prices typically rise because the market interprets the data as a sign of tightening supply.
On the other hand, smaller-than-expected withdrawals may signal weaker demand and lead to falling prices.
Why Natural Gas Storage Data Is Important

4
Natural gas is one of the most widely used energy resources in the United States.
It plays a critical role in several sectors, including:
- electricity generation
- residential heating
- chemical manufacturing
- fertilizer production
- industrial operations
Because of its widespread use, changes in natural gas supply can influence the broader economy.
For example, rising natural gas prices can increase electricity generation costs and lead to higher utility bills for consumers.
Similarly, industries that rely heavily on energy inputs may experience increased production expenses.
Natural Gas and Electricity Generation
Natural gas has become a dominant source of electricity production in the United States.
According to the U.S. Energy Information Administration, natural gas accounts for a large share of the country’s electricity generation capacity.
Power plants burn natural gas to generate electricity for homes, businesses, and industrial facilities.
Because electricity demand fluctuates depending on weather conditions and economic activity, natural gas consumption also varies.
When temperatures drop during winter months, heating demand increases significantly, leading to larger withdrawals from natural gas storage.
Weather and Natural Gas Demand
Weather conditions are one of the biggest drivers behind changes in natural gas inventories.
Cold weather increases heating demand across residential and commercial sectors.
In contrast, extremely hot weather can also increase natural gas consumption because power plants burn gas to generate electricity for air conditioning systems.
Energy traders often analyze weather forecasts alongside the EIA natural gas storage report March 12, 2026 to predict future supply and demand trends.
Meteorological models help market participants anticipate how future weather patterns might affect natural gas consumption.
LNG Exports and Global Energy Demand

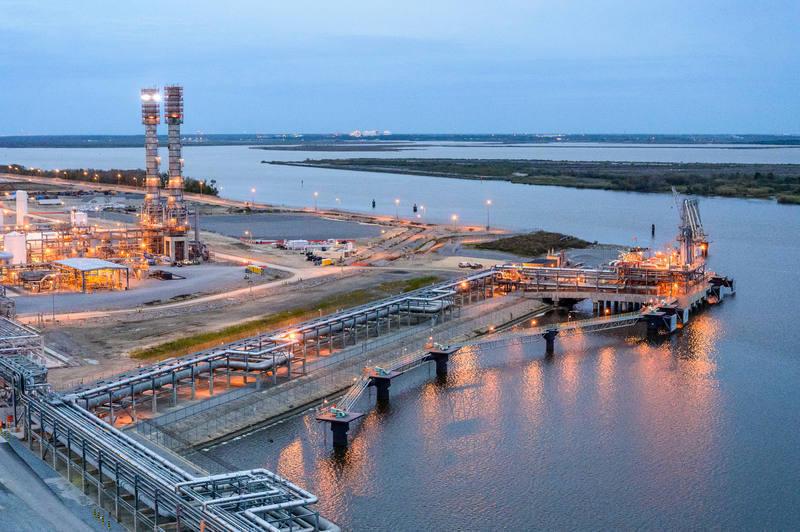
Another important factor influencing natural gas inventories is the rapid growth of liquefied natural gas (LNG) exports.
The United States has become one of the world’s largest exporters of LNG.
Liquefied natural gas is produced by cooling natural gas to extremely low temperatures until it becomes liquid. This process allows the gas to be transported internationally by specialized tanker ships.
Major LNG export facilities operated by companies such as Cheniere Energy ship natural gas to markets in:
- Europe
- Asia
- South America
Growing global demand for energy has increased U.S. LNG exports in recent years.
More information about LNG markets can be found here:
https://www.eia.gov/naturalgas/
Natural Gas Prices and Market Reactions
The EIA natural gas storage report March 12, 2026 often causes significant price movements in natural gas futures.
Energy traders follow price movements on financial platforms such as:
https://www.investing.com/commodities/natural-gas
https://www.tradingview.com/markets/commodities/
Natural gas futures contracts are traded on the Chicago Mercantile Exchange, which serves as one of the largest commodities trading platforms in the world.
Price movements depend heavily on how the reported storage numbers compare with market expectations.
If analysts predicted a smaller withdrawal but the actual number is larger, prices may move higher.
Conversely, if the withdrawal is smaller than expected, natural gas prices could decline.
Technical Outlook for Natural Gas Prices


Energy traders also analyze price charts to identify potential trading opportunities.
Technical analysis helps market participants determine key support and resistance levels.
Key Support Levels
- $2.40
- $2.30
Key Resistance Levels
- $2.70
- $3.00
If natural gas prices break above resistance levels, the market could enter a stronger bullish trend.
However, if supply conditions improve or weather forecasts turn warmer, prices may remain within a trading range.
More market data can be found here:
https://www.cmegroup.com/markets/energy/natural-gas.html
Natural Gas and Inflation
Energy prices are closely linked to inflation because they influence production costs across many industries.
When natural gas prices rise:
- electricity generation becomes more expensive
- manufacturing costs increase
- transportation expenses may rise
These cost increases can eventually lead to higher consumer prices.
For this reason, policymakers and economists monitor natural gas markets closely.
Energy price fluctuations can affect inflation indicators tracked by institutions such as the Federal Reserve.
Future Natural Gas Supply Trends
Several factors will likely influence future natural gas storage levels.
Increased Production
The United States has significantly expanded natural gas production through shale drilling.
Major producing regions include:
- the Permian Basin
- the Marcellus Shale
- the Haynesville Shale
These areas contain vast natural gas reserves that support the country’s energy supply.
Renewable Energy Competition
Renewable energy sources such as wind and solar power are gradually increasing their share of electricity generation.
However, natural gas remains an important backup power source because it can quickly ramp up electricity production when renewable generation fluctuates.
Global Energy Demand
Global energy demand continues to grow as economies expand and populations increase.
Natural gas is often considered a transition fuel because it produces fewer emissions than coal while still providing reliable energy.
Market Outlook Following the EIA Natural Gas Storage Report March 12, 2026
The 38 Bcf withdrawal reported in the EIA natural gas storage report March 12, 2026 highlights the ongoing importance of natural gas supply conditions in the energy market.
If future reports continue to show large withdrawals, the market may interpret this as a sign of tightening supply.
This could lead to stronger natural gas prices.
However, if production increases or weather conditions moderate, inventory levels may stabilize and prices could remain range-bound.
Energy markets will continue to monitor weekly storage data released by the U.S. Energy Information Administration to better understand the balance between supply and demand.
Frequently Asked Questions
What is the EIA natural gas storage report?
The EIA natural gas storage report is a weekly publication that shows the amount of natural gas stored in underground facilities across the United States.
What does Bcf mean?
Bcf stands for billion cubic feet, a measurement used to quantify large volumes of natural gas.
Why do natural gas inventories change?
Inventories change based on production levels, weather conditions, electricity demand, industrial consumption, and LNG export activity.
Where can I track natural gas prices?
Natural gas prices can be monitored on financial platforms such as:
https://www.investing.com
https://www.tradingview.com
https://www.cmegroup.com
Oil Shock Fears Rock Global Markets as Trump-Iran Crisis Escalates — Stocks, Gold and Forex React