

Gold Price Today (XAUUSD): Live Chart, Forecast & Analysis”(Intraday Analysis)
🟡 Gold Price Chart (XAUUSD) – Live Gold Price,
Read Gold Chart Analysis & Trading Strategy for today
Gold (XAU/USD)
Brent Crude Oil
S&P 500 Index
EUR/USD
Live Gold Price Chart (XAUUSD)
Gold (XAUUSD) remains one of the most actively traded assets in the global financial markets, driven by its dual role as both a safe-haven asset and a speculative trading instrument.
Today, gold price movements reflect a balance between:
- Global economic uncertainty
- Inflation expectations
- Central bank monetary policies
- Geopolitical developments
Unlike stocks or cryptocurrencies, gold reacts strongly to macro-level events, making it a key instrument for traders who understand market structure and sentiment.
🧠 Why Gold Is So Important in Trading
Gold is not just another commodity—it is a global financial indicator.
Traders and investors use gold to:
- Hedge against inflation
- Protect capital during uncertainty
- Diversify portfolios
- Trade volatility
When markets are uncertain, gold typically rises. When confidence returns, gold may pull back.
🔍 Key Factors That Move Gold Price
Understanding what moves gold is critical if you want to trade it successfully.
🏦 1. Interest Rates & Central Banks
Gold has an inverse relationship with interest rates.
- Rising interest rates → gold weakens
- Falling interest rates → gold strengthens
This is because gold does not yield interest, so higher rates make other assets more attractive.
💵 2. US Dollar Strength
Gold is priced in USD, so:
- Strong USD → gold falls
- Weak USD → gold rises
This makes the USD index a key indicator for gold traders.
🌍 3. Geopolitical Events
War, political instability, and global tensions often drive gold higher.
Examples include:
- Middle East tensions
- Trade wars
- Economic sanctions
📊 4. Inflation Data
Gold is widely seen as an inflation hedge.
- High inflation → bullish for gold
- Low inflation → bearish or neutral
📉 Technical Analysis of Gold (XAUUSD)
Gold trading is heavily driven by technical analysis, especially for short-term traders.
🔑 Key Levels to Watch
When analyzing gold, always identify:
- Support levels (buy zones)
- Resistance levels (sell zones)
- Breakout levels (trend continuation)
📊 Market Structure
Gold typically moves in:
- Trends (bullish or bearish)
- Ranges (sideways markets)
Understanding structure helps you avoid false signals.
🧠 Common Gold Trading Patterns
- Breakouts
- Pullbacks
- Reversals
- Consolidation zones
📊 Gold Trading Strategies That Work
🟢 1. Buy the Dip Strategy (Best in Bullish Market)
Gold often trends strongly upward during uncertain periods.
👉 Strategy:
- Wait for pullback to support
- Enter buy position
- Target next resistance
🔴 2. Breakout Trading Strategy
Gold frequently breaks key levels during news events.
👉 Strategy:
- Identify strong resistance
- Wait for breakout confirmation
- Enter with momentum
🟡 3. Range Trading Strategy
When gold is consolidating:
👉 Strategy:
- Buy at support
- Sell at resistance
- Avoid breakout traps
⚠️ Risk Management for Gold Traders
Gold is volatile—this is both an opportunity and a risk.
🔒 Key Rules:
- Never risk more than 1–2% per trade
- Always use stop loss
- Avoid overtrading
- Don’t trade during major news blindly
📊 Gold vs Other Markets
Understanding how gold interacts with other markets gives you an edge.
🪙 Gold vs Stocks
- Stocks up → gold may fall
- Stocks down → gold rises
🛢️ Gold vs Oil
- Oil inflation → gold bullish
- Oil crash → mixed impact
💱 Gold vs Forex (USD)
- USD strength → gold bearish
- USD weakness → gold bullish
🔗 Related Market Analysis (Internal Links)
To strengthen your understanding, explore:
👉 https://checkthetrend.com/xauusd-forecast-march-2026/
👉 https://checkthetrend.com/stocks-market-today-gold-oil-commodities/
👉 https://checkthetrend.com/weekly-forex-outlook/
📊 Gold Trading Outlook (Current Bias)
Based on current market conditions:
- Trend: Bullish to Neutral
- Key driver: Geopolitical + macro uncertainty
- Volatility: High
🎯 Trading Plan
- Buy dips in bullish structure
- Watch breakout zones
- Avoid trading during unclear consolidation
❓ Frequently Asked Questions (SEO BOOST)
What is the current gold price today?
Gold price (XAUUSD) changes in real-time based on global market conditions. Check the live chart above for current price.
Is gold a good investment in 2026?
Yes, gold remains a strong asset for hedging against inflation and economic uncertainty.
What is the best time to trade gold?
The best time is during:
- London session
- New York session
This is when volatility is highest.
Why is gold so volatile?
Gold reacts to:
- Economic data
- Interest rates
- Geopolitical events
How do beginners trade gold?
Start with:
- Basic technical analysis
- Demo account practice
- Simple strategies (support/resistance)
🚀 Final Thoughts: Why This Page Matters
This page is not just about checking gold price—it is about understanding:
- Why gold moves
- How to trade it
- When to enter and exit
Gold is one of the most powerful trading instruments, but only for those who approach it with strategy and discipline.
📊 XAUUSD H1 Analysis (Chart Breakdown)
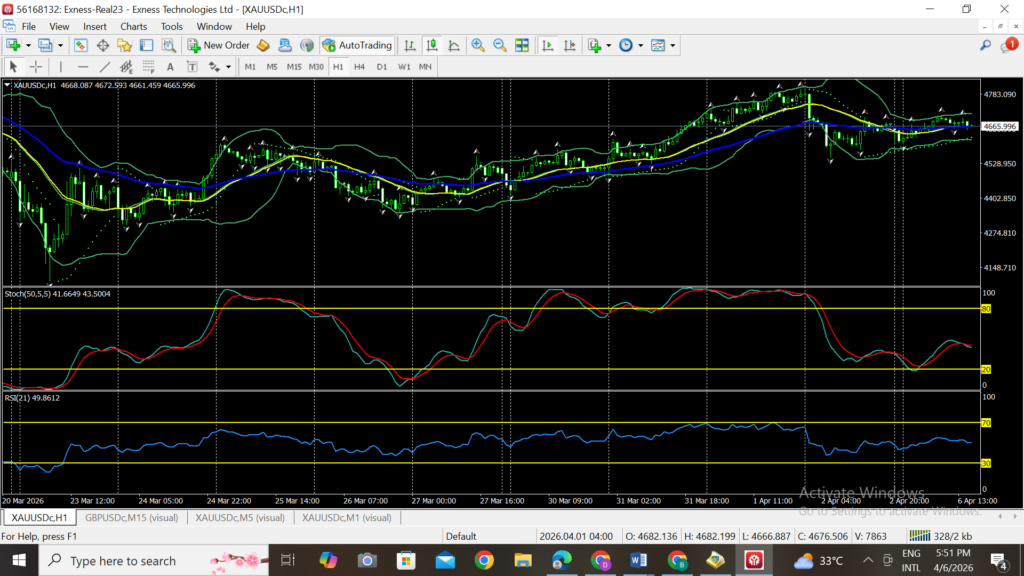
🔍 1. Market Structure (MOST IMPORTANT)
Looking at your H1 chart:
- Price moved from a downtrend → consolidation → uptrend
- Recently:
- Price made a strong bullish push
- Then entered sideways consolidation near the top
👉 This tells us:
The market is currently in a bullish structure but losing momentum
📈 2. Moving Averages (Trend Direction)
You’re using:
- Yellow (fast MA)
- Blue (slow MA)
What we see:
- Price is above both MAs
- MAs are still sloping upward
👉 Meaning:
Trend = Still Bullish
BUT…
- Price is now moving sideways around the MAs
👉 Early sign of possible trend weakening
🟢 3. Bollinger Bands (Volatility + Expansion)
- Bands expanded during the rally ✅
- Now:
- Bands are starting to contract
- Price is ranging near the middle/upper band
👉 Meaning:
Market is entering consolidation phase
⚡ 4. Parabolic SAR (Your Dots)
- Dots recently flipped above and below price multiple times
👉 This is KEY:
❗ Frequent flips = No clear trend → ranging market
🔁 5. Stochastic (50,5,5)
- Recently dropped from overbought (80+)
- Now moving around mid-zone
👉 Meaning:
- Momentum has shifted from bullish → neutral
📉 6. RSI (21)
- RSI was high → now around 50 level
👉 This confirms:
Market is neutral (no strong momentum)
🧠 FINAL MARKET INTERPRETATION
Putting everything together:
✅ Bullish factors:
- Price above moving averages
- Overall higher highs structure
❗ Bearish / caution signals:
- Stochastic dropping
- RSI neutral
- Bollinger contraction
- SAR flipping
🔮 FORECAST (What Happens Next?)
🎯 Scenario 1: CONTINUATION (Higher Probability)
If buyers return:
- Price will:
- Bounce from MA zone
- Break recent high (~resistance)
👉 Then:
Gold continues bullish trend
⚠️ Scenario 2: CORRECTION (Also likely)
If sellers gain control:
- Price will:
- Break below MAs
- Move toward lower Bollinger band
👉 Then:
Short-term bearish pullback begins
📊 KEY LEVELS TO WATCH
🔼 Resistance:
- Recent high (around 4780 area)
🔽 Support:
- MA zone (~4650–4670 area)
- Lower structure (~4520 area)
💡 BEST TRADING STRATEGY RIGHT NOW
🟡 Current Condition: RANGE / CONSOLIDATION
👉 So avoid trend trading blindly
✅ Option 1: Range Trading (BEST NOW)
- Sell near resistance
- Buy near support
- Use tight stop loss
✅ Option 2: Breakout Trading
Wait for:
🔼 Buy Setup:
- Strong breakout above resistance
- Stochastic turning up
- RSI above 55
🔽 Sell Setup:
- Break below MA + support
- RSI below 45
- Stochastic heading down
🚨 WHAT YOU SHOULD NOT DO
❌ Don’t chase buys at the top
❌ Don’t trade in the middle of the range
❌ Don’t rely on one indicator
🔥 PRO INSIGHT (VERY IMPORTANT)
This chart is showing a classic:
“Trend → Exhaustion → Consolidation → Next Move”
👉 The next big move is coming
👉 But it hasn’t confirmed direction yet
🎯 SIMPLE SUMMARY
- Trend: Bullish but slowing
- Current phase: Consolidation
- Best strategy: Range or breakout wait
- Next move: Impulsive move soon (watch breakout)
👍 Next step (this will help you A LOT)
I can now:
👉 Want deeper insights?
Explore our full gold analysis:
👉 Or learn trading strategies: