🚨 Weekly Stock Market Outlook (Mar 9–15, 2026): Oil Shock, Bitcoin and Gold surge, AI stock response to Iran Tensions & Key Economic Data Could Shake Markets
Global stock markets continues to face volatility this week as oil price surges above $100 amid U.S.–Iran tensions. Discover the weekly stock market outlook for Mar 9–15 2026 with key economic events, stock trends, oil impact, and technical market signals.
📊 Weekly Stock Market Outlook (March 9–15, 2026)
Global financial markets enter the second week of March under significant pressure as a combination of geopolitical tensions, surging oil prices, and crucial economic data releases reshape investor sentiment. The escalation of conflict involving the United States and Iran has injected a fresh wave of uncertainty into global markets, triggering what analysts describe as an “energy shock” across financial systems. Reports of military operations and heightened tensions in the Middle East have raised fears about potential disruptions to oil supply routes, particularly through the strategically critical Strait of Hormuz, which handles roughly one-fifth of the world’s crude oil shipments. As a result, crude prices have surged sharply, sending ripples through equity markets, currency markets, and commodities trading desks worldwide.
🔗 Reuters coverage of oil supply risk:
https://www.reuters.com/business/energy/

The sudden rise in oil prices has already begun influencing stock market behavior. Energy stocks have shown signs of strength as investors anticipate higher revenues for oil producers and exploration companies. At the same time, industries heavily dependent on fuel—such as airlines, logistics firms, and transportation companies—have faced renewed selling pressure due to rising operational costs. Historically,
This week’s outlook blends geopolitical risk, macroeconomic data, and sector-specific drivers to give investors and traders a complete view of what to expect in the stock market between March 9 and March 15, 2026.
Oil Shock Fears Rock Global Markets as Trump-Iran Crisis Escalates — Stocks, Gold and Forex React
Elon Musk News Today: Tesla Legal Risk, X Money, and Platform Changes Could Move Global Markets
Trump News Today (March 6, 2026): Oil Shock, Tariffs, and War Risks Shake Global Markets
🌍 Global Market Sentiment: Oil Shock Drives Volatility

The biggest market driver right now is the sudden surge in oil prices following escalating military conflict in the Middle East. Reports from multiple global financial news outlets indicate that crude oil surged nearly 20% in early trading, reaching its highest levels in several years as investors fear severe supply disruptions through the Strait of Hormuz, one of the most strategically important energy shipping routes in the world. According to energy analysts and market commentators, roughly 20% of global oil shipments pass through this narrow waterway, making any disruption there a major concern for global markets. For updated energy market news, traders often monitor platforms such as
https://www.investing.com/commodities/crude-oil and
https://www.reuters.com/markets/commodities/.
The crisis intensified after reports of attacks targeting Iranian energy infrastructure and retaliatory threats directed at commercial shipping vessels operating in the Persian Gulf. The geopolitical tension has raised fears that oil tankers could face increased risks when passing through the region. Insurance premiums for cargo shipments have already begun to rise, and several shipping companies are reportedly reviewing their routes to avoid high-risk areas.

These developments have pushed Brent crude and WTI crude prices above the $100 per barrel level, a psychological and economic threshold that tends to trigger market-wide reactions. Energy markets historically react quickly to geopolitical instability, particularly when major oil-producing regions are involved. The Middle East accounts for a substantial share of global oil production, and any supply uncertainty can send prices sharply higher within hours. Traders frequently track real-time commodity price movements through tools such as
https://www.tradingview.com/markets/commodities/ and
https://finviz.com/futures.ashx.
The surge in oil prices is not just an energy story; it has broad implications for the global economy. Oil remains one of the most important inputs for industrial production, transportation, agriculture, and manufacturing. When crude prices rise rapidly, the effects ripple through almost every sector of the economy.
One of the most immediate impacts is increased production costs for businesses. Companies that rely heavily on fuel, such as airlines, shipping firms, trucking companies, and manufacturing industries, suddenly face higher operational expenses. These companies must either absorb the higher costs, which reduces profit margins, or pass them on to consumers in the form of higher prices. Historically, sudden oil price spikes have squeezed corporate earnings, particularly in sectors with thin profit margins.
Transportation expenses are another major channel through which oil price shocks affect the broader economy. Fuel costs play a crucial role in logistics, supply chains, and international trade. As oil prices rise, the cost of transporting goods by air, sea, and land increases. This can lead to higher prices for everyday consumer products, from food and clothing to electronics and automobiles. Investors closely watch these developments because rising logistics costs can weaken consumer demand and reduce economic growth.
Higher oil prices also contribute directly to rising inflation expectations. Energy costs are a key component of inflation metrics such as the Consumer Price Index (CPI). When gasoline, diesel, and heating oil become more expensive, households feel the impact almost immediately. Central banks pay close attention to energy-driven inflation because it can spread into other parts of the economy, including wages, services, and consumer goods.
The possibility of a renewed inflation wave is particularly concerning for investors because many central banks around the world have spent the past two years fighting high inflation through aggressive interest rate hikes. If oil prices remain elevated, policymakers may find it difficult to cut rates as quickly as markets had hoped. Analysts frequently track inflation expectations and central bank signals through resources such as
https://www.forexfactory.com/calendar and
https://www.investing.com/economic-calendar/.
Higher interest rates can place additional pressure on financial markets. When borrowing costs remain elevated, companies face higher expenses for financing investments, expanding operations, or refinancing debt. Consumers also experience higher costs for mortgages, credit cards, and loans. This combination tends to slow economic activity, which is why financial markets often react negatively to sustained inflation pressures.
These factors have already led to declines in major stock indices. The Dow Jones Industrial Average and the S&P 500 both moved lower as investors shifted funds toward safer assets such as gold, government bonds, and defensive sectors. Energy stocks, however, have benefited from the surge in crude prices, as higher oil prices typically translate into stronger revenues for oil producers and exploration companies. Market participants often track stock sector performance through heat maps and market dashboards available on
https://finviz.com/ and
https://www.marketwatch.com/.
Another notable market reaction has been the surge in safe-haven assets. Gold prices have moved higher as investors look for protection against geopolitical risk and inflation uncertainty. Historically, gold tends to perform well during periods of geopolitical tension, particularly when energy prices rise sharply. Traders watching the precious metals market often follow gold charts at
https://www.investing.com/commodities/gold and
https://www.kitco.com/.
Currency markets have also begun reacting to the oil price shock. Oil-exporting countries such as Canada and Norway often see their currencies strengthen when oil prices rise, while oil-importing economies may experience currency weakness due to higher energy import costs. Forex traders are closely watching pairs such as USD/CAD, EUR/USD, and emerging market currencies to gauge the broader impact of the energy crisis.
Beyond immediate market reactions, investors are increasingly concerned about the possibility of stagflation, a scenario in which economic growth slows while inflation remains elevated. Stagflation environments are particularly challenging for policymakers because raising interest rates can slow growth further, while cutting rates may fuel additional inflation.
Financial strategists warn that if oil prices remain above $100 per barrel for an extended period, global economic growth forecasts may need to be revised downward. Emerging economies, which are often more sensitive to energy costs, could face additional challenges if fuel imports become significantly more expensive.
Looking ahead, market participants will be closely monitoring developments in the Middle East, including diplomatic negotiations, military actions, and shipping conditions in the Strait of Hormuz. Any signs of de-escalation could quickly ease oil prices and stabilize markets. Conversely, further disruptions to energy infrastructure or shipping routes could trigger another surge in crude prices.
For investors and traders, the current environment highlights how quickly geopolitical events can reshape global markets. Energy prices, inflation expectations, and central bank policies are now deeply interconnected, meaning that developments in one area can ripple through stocks, commodities, currencies, and bonds.
As the situation continues to evolve, market volatility is likely to remain elevated. Investors are advised to monitor energy prices, economic data releases, and geopolitical headlines closely, as these factors will play a critical role in determining whether the current oil shock becomes a short-term spike or a longer-lasting economic challenge.
Higher oil prices can affect the stock market through multiple channels:
- Increased production costs for businesses
- Rising transportation expenses
- Higher inflation expectations
- Pressure on central banks to keep interest rates elevated
These factors have already led to declines in major stock indices, with the Dow Jones and S&P 500 falling as investors shift into safer assets.
📉 Wall Street Performance Last Week
Before entering this new trading week, U.S. markets already showed signs of stress.Before entering this new trading week, U.S. financial markets were already showing clear signs of stress, driven by a combination of geopolitical tensions, rising commodity prices, and growing uncertainty about the global economic outlook. Investors were navigating an environment filled with conflicting signals: strong energy prices supporting certain sectors, while inflation fears and higher interest rates continued to pressure equities across the broader market.
Market analysts monitoring platforms such as
https://www.investing.com/indices/major-indices and
https://www.marketwatch.com/investing/index
have noted that volatility has increased steadily over recent sessions as investors reassess risk exposure ahead of key economic data and geopolitical developments.
One of the clearest signs of market stress came from the Dow Jones Industrial Average, which experienced a sharp decline amid the surge in oil prices and escalating geopolitical fears. The Dow Jones, often viewed as a barometer for traditional industrial and blue-chip companies, tends to react strongly when economic uncertainty increases. Many of the companies in the index operate in sectors that are particularly sensitive to energy costs, including transportation, manufacturing, and heavy industry.
When oil prices surge, these businesses face higher input costs, which can reduce profit margins and lead investors to reassess corporate earnings expectations. As a result, traders often reduce exposure to cyclical sectors during periods of energy price volatility. Financial media outlets like
https://www.cnbc.com/markets/ and
https://www.reuters.com/markets/
have highlighted that several major Dow components experienced selling pressure as investors shifted capital into defensive assets.
At the same time, the S&P 500 index, which tracks the performance of 500 of the largest publicly traded companies in the United States, also declined as consumer and industrial stocks weakened. Because the S&P 500 covers a wide range of sectors—including consumer goods, financial services, healthcare, technology, and energy—it provides a more comprehensive picture of the overall market environment.
Recent trading sessions showed clear sector divergence within the index. Consumer discretionary stocks struggled as investors worried that higher energy costs could reduce household spending power. When gasoline prices rise, consumers often cut back on non-essential purchases such as travel, entertainment, luxury goods, and retail shopping. Companies operating in these industries may see declining demand if fuel costs remain elevated for an extended period.
Industrial stocks within the S&P 500 also experienced weakness due to concerns about rising transportation costs, supply chain disruptions, and slowing global trade. Many industrial companies depend heavily on shipping networks, raw materials, and energy-intensive manufacturing processes. When oil prices spike, operating expenses increase rapidly, which can weigh on profitability.
Investors closely track sector performance and market heat maps using tools such as
https://finviz.com/map.ashx and
https://www.tradingview.com/markets/stocks-usa/heatmap/.
These platforms provide visual representations of how different industries are performing relative to each other, making it easier to identify where capital is flowing during periods of market stress.
Meanwhile, the Nasdaq Composite Index presented a more mixed performance. Technology stocks provided some degree of support for the index, but the broader tech sector remained under pressure due to persistent concerns about interest rates and valuation levels.
Technology companies are particularly sensitive to changes in interest rates because many of them rely heavily on future earnings growth rather than current profits. When interest rates remain elevated, the present value of those future earnings declines, which can make high-growth tech stocks less attractive to investors.
Despite this challenge, certain technology giants continued to show relative resilience. Large-cap firms with strong balance sheets, dominant market positions, and consistent revenue growth often attract investors during periods of uncertainty. Some analysts believe that the technology sector’s long-term structural growth in areas such as artificial intelligence, cloud computing, and digital infrastructure continues to support investor interest.
Market commentary from sources like
https://www.nasdaq.com/market-activity and
https://www.bloomberg.com/markets
has emphasized that while technology stocks remain volatile, they still play a crucial role in stabilizing broader equity indices during turbulent periods.
In contrast to the broader market weakness, energy stocks moved sharply higher, benefiting directly from the surge in crude oil prices. When oil prices climb, energy companies typically experience immediate improvements in revenue expectations, since higher crude prices translate into higher profits for producers, refiners, and exploration firms.
Major oil companies, including integrated energy producers and oilfield service providers, tend to outperform during commodity price rallies. Investors seeking exposure to rising energy prices often rotate capital into these stocks as a hedge against inflation and geopolitical uncertainty.
Energy sector performance can be monitored through sector indices and exchange-traded funds such as those listed on
https://www.spglobal.com/spdji/en/indices/equity/sp-500-energy-sector/ and
https://www.etf.com/.
Oil exploration companies, pipeline operators, and energy infrastructure firms all stand to benefit when crude prices surge. Higher oil prices increase cash flow for producers and can encourage increased drilling activity, which supports demand for oilfield services and equipment.
However, while the energy sector may benefit in the short term, rising oil prices can still create broader challenges for financial markets. If energy costs remain elevated for too long, they can slow economic growth by increasing costs across nearly every industry. This dynamic creates a complex environment where certain sectors perform well while others struggle.
Another important factor influencing market sentiment is the growing concern that higher energy prices could reignite inflation pressures. Energy costs are a major component of inflation metrics such as the Consumer Price Index (CPI). If gasoline and fuel prices continue rising, central banks—including the Federal Reserve—may face additional pressure to maintain restrictive monetary policies.
Investors are closely watching upcoming economic data releases to determine whether inflation could accelerate again. Key indicators such as consumer inflation, producer prices, and employment figures will provide insight into how the economy is responding to the current energy shock.
Economic calendars and data releases can be tracked through resources like
https://www.forexfactory.com/calendar and
https://www.investing.com/economic-calendar/.
Market strategists also warn that geopolitical risks remain one of the most unpredictable drivers of financial markets. Events such as military conflicts, sanctions, shipping disruptions, and diplomatic tensions can quickly alter investor sentiment and commodity prices.
For example, the possibility of supply disruptions through the Strait of Hormuz, which handles a significant portion of global oil exports, has amplified market concerns about energy security. If shipping routes become restricted or insurance costs rise dramatically, oil prices could remain elevated for an extended period.
As the new trading week begins, investors are entering the market with heightened caution. Portfolio managers are increasingly focusing on risk management, diversification, and sector rotation strategies to navigate the uncertain environment.
Defensive sectors such as healthcare, utilities, and consumer staples may attract increased investor interest if market volatility persists. At the same time, commodities like gold and oil are likely to remain key assets for traders seeking protection against geopolitical risk and inflation.
Ultimately, the performance of U.S. stock markets in the coming days will depend on several key factors: geopolitical developments in the Middle East, the direction of oil prices, upcoming economic data releases, and signals from central banks regarding interest rate policy.
Until greater clarity emerges, investors should expect continued volatility across equities, commodities, and currencies. Monitoring global news, market indicators, and technical levels will remain essential for traders attempting to navigate this complex and rapidly evolving financial landscape.
In summary, according to market reports:
- The Dow Jones Industrial Average fell sharply amid rising oil prices and geopolitical fears.
- The S&P 500 declined as consumer and industrial stocks weakened.
- The Nasdaq showed mixed performance, supported slightly by technology stocks but still under pressure.
Energy stocks, however, moved in the opposite direction, benefiting from the spike in crude prices and expectations of stronger revenue in the oil sector.
📅 Key Economic Events This Week (Mar 9–15, 2026)

A busy economic calendar means traders and investors should expect heightened volatility across global financial markets this week. Economic data releases often serve as catalysts for large market moves because they provide critical insights into the health of the economy, inflation trends, and future central bank policy decisions. When several high-impact reports are scheduled within a short period, financial markets can become especially sensitive to surprises in the data.
Professional traders closely follow economic calendars to prepare for these events. Platforms such as
https://www.forexfactory.com/calendar and
https://www.investing.com/economic-calendar/
list upcoming macroeconomic reports, central bank speeches, and geopolitical announcements that can influence stocks, forex, commodities, and bond markets.
These calendars categorize economic events by their expected market impact—low, medium, or high—helping traders identify which releases could trigger major price movements. This week features several high-impact data points, including the U.S. Consumer Price Index (CPI) inflation report and the University of Michigan Consumer Sentiment Index.
Together, these reports provide a powerful snapshot of two critical components of the economy: inflation and consumer behavior. Because consumer spending accounts for roughly two-thirds of the U.S. economy, any signals regarding inflation trends or consumer confidence can quickly influence stock market expectations.
Why Economic Data Drives Financial Markets
Economic indicators help investors understand the broader direction of the economy. When the data shows strong growth, rising employment, and stable inflation, markets often react positively because corporate earnings are likely to improve.
However, when inflation rises too quickly or economic growth begins to slow, investors become more cautious. Central banks may respond by adjusting monetary policy, particularly interest rates, which can significantly affect stock valuations, bond yields, and currency markets.
One of the most important central banks in the world is the U.S. Federal Reserve. Because the United States is the largest economy globally, decisions made by the Federal Reserve influence financial markets around the world. Investors frequently monitor updates and economic commentary on the Federal Reserve’s official website:
https://www.federalreserve.gov/monetarypolicy.htm
The Federal Reserve’s main goals include maintaining price stability and maximum employment. To achieve these objectives, policymakers analyze inflation indicators, labor-market conditions, and consumer spending trends.
When economic data deviates from expectations, markets can react quickly as investors adjust their forecasts for future Federal Reserve decisions.
Wednesday – U.S. CPI Inflation Report
One of the most important economic releases scheduled this week is the U.S. Consumer Price Index (CPI) report, which measures changes in the price level of a basket of goods and services purchased by households.
The CPI is widely considered one of the most influential economic indicators because it provides direct insight into inflation trends. Inflation data plays a central role in shaping monetary policy, as central banks use it to determine whether interest rates should rise, fall, or remain unchanged.
The Bureau of Labor Statistics publishes CPI data monthly, and investors closely analyze the results to gauge whether inflation is accelerating or cooling. Detailed CPI information can be accessed through:
https://www.bls.gov/cpi/
If the CPI report shows higher-than-expected inflation, several market reactions could occur:
1. Delay in Interest Rate Cuts
Financial markets currently expect central banks to eventually reduce interest rates as inflation cools. However, if inflation remains stubbornly high, policymakers may decide to keep rates elevated for longer than previously anticipated.
Higher interest rates tend to slow economic growth because borrowing becomes more expensive for both businesses and consumers. Companies may delay investments, and households may reduce spending on homes, vehicles, and other major purchases.
As a result, stock markets often react negatively to unexpectedly strong inflation data.
2. Pressure on Growth and Technology Stocks
Growth stocks, particularly in the technology sector, are highly sensitive to changes in interest rates. Many tech companies rely on expectations of strong future earnings rather than immediate profits.
When interest rates rise, the present value of those future earnings declines, making high-growth companies less attractive to investors. This dynamic explains why technology stocks often experience significant volatility following major inflation reports.
Market participants frequently analyze technology-sector movements through platforms such as
https://www.nasdaq.com/market-activity and
https://finviz.com/.
3. Strengthening of the U.S. Dollar
Higher inflation often leads to expectations of tighter monetary policy. If investors believe the Federal Reserve will maintain higher interest rates, the U.S. dollar typically strengthens because higher yields attract global capital.
Currency traders closely watch inflation data because it can cause significant moves in major forex pairs such as EUR/USD, GBP/USD, and USD/JPY.
Real-time forex market movements can be monitored at:
https://www.tradingview.com/markets/currencies/ and
https://www.investing.com/currencies/.
A stronger U.S. dollar can also influence global markets by making commodities such as oil and gold more expensive for international buyers.
Friday – Consumer Sentiment Index
Another key economic release scheduled for this week is the University of Michigan Consumer Sentiment Index, which measures consumer confidence and expectations regarding the economy.

This index surveys households across the United States to evaluate their views on personal finances, employment prospects, and future economic conditions. Because consumer spending drives a large portion of economic activity, shifts in sentiment can provide early warnings about changes in consumption patterns.
Detailed information about the index can be found at:
https://data.sca.isr.umich.edu/
If consumer sentiment weakens significantly, it may signal that households are becoming more cautious about spending. This could have several implications for financial markets.
1. Slowing Consumer Spending
When consumers feel less confident about their financial outlook, they tend to reduce discretionary spending. This includes purchases such as vacations, luxury goods, electronics, and entertainment.
Retailers and consumer discretionary companies are particularly sensitive to changes in consumer confidence. If sentiment declines sharply, stocks in sectors such as retail, travel, and hospitality may experience selling pressure.
Investors often track retail-sector performance using resources like:
https://www.marketwatch.com/investing/index and
https://finviz.com/groups.ashx
2. Impact on Corporate Earnings Expectations
Consumer spending plays a critical role in corporate revenue growth. When households reduce spending, companies may experience slower sales growth, which can lead to downward revisions in earnings forecasts.
Equity analysts frequently adjust earnings expectations based on shifts in economic indicators, including consumer sentiment.
3. Inflation Expectations
Another important component of the University of Michigan survey is consumer inflation expectations. The survey asks households how much they expect prices to rise over the next year and over longer periods.
If consumers expect inflation to remain high, it can influence wage demands and purchasing behavior, potentially creating a feedback loop that keeps inflation elevated.
Because of this dynamic, central banks closely monitor inflation expectations when making monetary policy decisions.
Why Traders Expect Volatility This Week
With both inflation data and consumer confidence reports scheduled within the same week, financial markets could experience significant volatility.
If inflation comes in hotter than expected while consumer confidence weakens, investors may fear a scenario where inflation remains high while economic growth slows. This situation, often referred to as stagflation, is particularly challenging for policymakers and financial markets.
On the other hand, if inflation cools while consumer confidence remains stable, markets may interpret the data as a sign that the economy is achieving a “soft landing,” where inflation declines without triggering a recession.
Such an outcome could support equity markets and improve investor sentiment.
Preparing for Market Volatility
Given the number of important economic events scheduled this week, traders and investors should prepare for potential market swings. Many professionals use economic calendars and market analytics tools to stay informed and manage risk.
Some of the most widely used resources include:
• https://www.forexfactory.com
• https://www.investing.com
• https://www.tradingview.com
• https://finviz.com
These platforms provide real-time data, market charts, and economic event schedules that help traders make informed decisions.
Ultimately, this week’s economic reports could play a major role in shaping market expectations for interest rates, inflation trends, and the broader economic outlook. As investors analyze each data release, markets are likely to remain highly reactive, making risk management and careful analysis more important than ever.
📈 Sector Outlook for the Week
🛢 Energy Sector: Strong Momentum


Energy stocks are expected to remain strong if oil prices continue to rise.
Companies involved in oil exploration, refining, and energy services are often among the biggest beneficiaries when geopolitical tensions trigger a surge in global oil prices. When supply disruptions occur—particularly in major oil-producing regions such as the Middle East—energy companies can experience rapid increases in revenue and profitability because crude oil becomes more valuable in global markets.
The recent geopolitical tensions surrounding energy infrastructure and shipping routes in the Middle East have once again highlighted how sensitive global oil markets are to supply shocks. Oil traders, institutional investors, and governments are closely watching developments in the region because even small disruptions can have outsized effects on global energy prices.
Financial news outlets and commodity market platforms such as
https://www.investing.com/commodities/crude-oil
and
https://www.reuters.com/markets/commodities/
provide real-time updates on crude oil prices and geopolitical developments that influence energy markets.
Why Geopolitical Tensions Affect Oil Markets
Oil is one of the most globally traded commodities, and a large share of the world’s oil production originates from politically sensitive regions. The Middle East alone accounts for a significant portion of global crude oil supply, with major exporters including Saudi Arabia, Iran, Iraq, Kuwait, and the United Arab Emirates.
One of the most critical strategic locations in global energy trade is the Strait of Hormuz, a narrow shipping corridor that connects the Persian Gulf with international waters. According to global energy reports, roughly one-fifth of the world’s oil supply passes through this route every day. Any threat to shipping lanes in this area can trigger immediate price reactions in global markets.
Detailed analysis of global oil supply and shipping routes can be found through energy market research platforms such as:
https://www.eia.gov/international/analysis/regions-of-interest/Strait_of_Hormuz.php
When geopolitical tensions escalate—whether through military conflict, sanctions, or attacks on energy infrastructure—oil traders often price in the risk of future supply disruptions. Even the possibility of reduced exports can lead to a sharp increase in crude prices.
Supply Shocks and Oil Price Surges
A supply shock occurs when the availability of a commodity suddenly declines or becomes uncertain. In the case of oil markets, supply shocks can result from several factors, including:
• attacks on oil production facilities
• sanctions limiting exports
• shipping disruptions in key maritime routes
• political instability in producing countries
• decisions by producer alliances such as OPEC+
When such disruptions occur, oil prices often rise quickly because global demand for energy remains relatively constant in the short term. Industries such as transportation, manufacturing, and power generation depend heavily on oil and petroleum products, making it difficult for economies to quickly reduce consumption.
Traders and analysts track oil futures and market expectations through financial data platforms like:
https://www.tradingview.com/markets/futures/ and
https://finviz.com/futures.ashx
These tools provide real-time charts and technical analysis indicators that help investors understand market trends and potential price movements.
Oil Exploration Companies Stand to Benefit
Oil exploration and production companies—often referred to as upstream energy firms—are among the primary beneficiaries when crude prices surge.
These companies focus on discovering and extracting crude oil from underground reservoirs. When oil prices increase, the value of each barrel they produce rises significantly. Because many of their operational costs remain relatively stable in the short term, higher oil prices can dramatically boost profit margins.
Major global oil exploration companies include large integrated firms and independent producers. Some of the most widely traded energy companies can be tracked through stock market platforms such as:
https://www.marketwatch.com/investing/sector/energy and
https://www.nasdaq.com/market-activity/stocks
When oil prices climb above key thresholds—such as $90 or $100 per barrel—many exploration projects that were previously considered unprofitable suddenly become financially viable. As a result, companies may increase drilling activity, expand production capacity, or invest in new exploration projects.
Refining Companies and Rising Margins
Refining companies represent another important segment of the energy sector that can benefit from geopolitical supply shocks.
Refineries purchase crude oil and process it into refined petroleum products such as gasoline, diesel, jet fuel, and heating oil. When crude prices rise due to supply disruptions, the price of refined products often increases as well.
The profitability of refining companies depends largely on the “crack spread,” which is the difference between the cost of crude oil and the price of refined products. During periods of tight supply, refined fuel prices can rise even faster than crude oil prices, increasing refining margins.
This dynamic can significantly boost the revenues of refining companies and integrated energy firms that operate both upstream and downstream operations.
Oilfield Services and Equipment Providers
Another category of companies that may benefit from rising oil prices includes oilfield service providers. These firms supply the equipment, technology, and technical expertise required for drilling, exploration, and energy infrastructure development.
Examples of services provided by these companies include:
• drilling technology and equipment
• seismic surveys and geological analysis
• offshore platform construction
• pipeline installation
• maintenance of oil production facilities
When oil prices rise, exploration companies typically increase their drilling activities to capitalize on higher revenue opportunities. This increase in activity creates additional demand for oilfield services and equipment.
Investors often monitor the performance of the energy services sector through industry analysis platforms such as:
https://www.spglobal.com/commodityinsights/en and
https://www.bloomberg.com/energy.
Analysts Expect Oil Prices Could Rise Further
Many energy market analysts believe that if disruptions in Middle Eastern oil exports persist, crude prices could move even higher in the coming weeks or months.
The Middle East remains one of the world’s most important energy hubs, and any long-term disruption to production or shipping could tighten global supply significantly.
Analysts monitoring global oil markets frequently highlight several factors that could push prices higher:
1. Reduced Export Capacity
If major oil exporters face infrastructure damage or export restrictions, global supply could decline quickly. Because oil demand remains relatively stable in the short term, reduced supply tends to push prices upward.
2. Shipping Risks and Insurance Costs
When geopolitical tensions increase, shipping companies often face higher insurance premiums for transporting oil through high-risk regions. Some vessels may avoid certain routes entirely, leading to longer delivery times and reduced shipping capacity.
3. Strategic Oil Reserves
Governments may release oil from strategic petroleum reserves to stabilize markets during supply disruptions. However, these reserves are limited and typically intended as temporary emergency measures.
Information about strategic petroleum reserves and global energy supply data can be found through:
https://www.energy.gov/ and
https://www.iea.org/
4. Market Speculation
Oil markets are heavily influenced by speculation from hedge funds, commodity traders, and institutional investors. If traders believe supply disruptions will persist, they may increase their positions in oil futures contracts, pushing prices even higher.
Broader Economic Implications
While energy companies may benefit from rising oil prices, the broader economic impact of a sustained oil rally can be mixed.
Higher energy prices increase costs for businesses and consumers, potentially slowing economic growth. Industries such as airlines, logistics, manufacturing, and agriculture often face higher operating expenses when fuel prices rise.
At the same time, oil-exporting countries may experience increased revenue from energy exports, strengthening their fiscal positions and supporting economic growth in those regions.
What Investors Are Watching Next
As geopolitical tensions continue to influence energy markets, investors are closely monitoring several key developments:
• diplomatic negotiations and military activity in the Middle East
• potential disruptions to oil shipping routes
• production decisions by major oil exporters
• global demand trends in major economies
Real-time oil market developments can be tracked through leading financial news platforms such as:
https://www.cnbc.com/energy/
https://www.bloomberg.com/markets/commodities
If supply disruptions persist or escalate, crude oil prices could continue rising, further strengthening the outlook for energy companies involved in exploration, refining, and energy services. For traders and investors, the energy sector remains one of the most closely watched areas of the global financial markets during periods of geopolitical uncertainty.
💻 Technology Stocks: Sensitive to Interest Rates
Technology stocks remain among the most interest-rate–sensitive sectors in global financial markets, which means their performance is closely tied to changes in inflation expectations, central bank policy, and government bond yields. As investors enter this week of key economic data releases—particularly the U.S. Consumer Price Index (CPI)—market participants are paying close attention to how inflation trends could influence the future path of interest rates.
Economic indicators and policy expectations can dramatically affect valuations in the technology sector. Investors frequently monitor macroeconomic developments through resources such as
https://www.forexfactory.com/calendar and
https://www.investing.com/economic-calendar/
which highlight upcoming inflation reports, central bank speeches, and other high-impact events that can move financial markets.
Why Technology Stocks React Strongly to Interest Rates
Technology companies, particularly high-growth firms, tend to derive a large portion of their value from future expected earnings rather than immediate profits. Because of this, their stock valuations depend heavily on discount rates used in financial models.
When interest rates rise, the present value of those future earnings declines. This makes growth-oriented companies—especially in sectors like software, artificial intelligence, and cloud computing—more vulnerable to market corrections.
Financial analysts and traders often track the broader technology sector using indices such as the Nasdaq Composite and the Nasdaq-100, both of which contain a high concentration of technology firms. Market data and sector performance can be monitored through platforms such as:
https://www.nasdaq.com/market-activity
https://www.tradingview.com/markets/stocks-usa/
https://finviz.com/
If inflation data comes in higher than expected this week, several market reactions could unfold quickly.
Treasury Yields May Rise
One of the most immediate consequences of higher inflation data is an increase in U.S. Treasury yields. Bond markets react quickly to inflation because rising prices reduce the purchasing power of fixed-income investments.
If investors expect the Federal Reserve to keep interest rates higher for longer—or even consider additional rate hikes—yields on government bonds typically move upward. The U.S. 10-year Treasury yield, in particular, is widely used as a benchmark for global financial markets.
Bond yields can be tracked in real time through financial platforms such as:
https://www.cnbc.com/bonds/
https://www.investing.com/rates-bonds/
https://www.marketwatch.com/investing/bond
Higher Treasury yields tend to create competition for stocks because investors can earn relatively attractive returns from safer fixed-income assets.
Growth Stocks Could Face Renewed Selling Pressure
When bond yields rise, growth stocks often face selling pressure. Investors may rotate capital away from high-valuation technology firms and toward sectors that benefit from higher interest rates, such as financials or energy.
During previous inflation shocks, markets frequently witnessed significant volatility in technology stocks because many of these companies were trading at premium valuations based on long-term growth expectations.
Large institutional investors—including hedge funds and pension funds—often rebalance portfolios in response to changing interest-rate conditions. This process can create rapid shifts in sector performance.
Market heat maps showing sector rotation can be viewed through platforms like:
https://finviz.com/map.ashx
https://www.tradingview.com/markets/stocks-usa/sector-and-industry/
These tools help traders visualize where capital is flowing during periods of market volatility.
Artificial Intelligence Companies Continue to Attract Investor Attention
Despite the sensitivity of technology stocks to interest rates, certain segments of the tech sector continue to attract strong investor interest—particularly companies involved in artificial intelligence (AI) and advanced computing.
AI technology is rapidly transforming industries such as healthcare, finance, cybersecurity, robotics, and cloud computing. Large corporations and governments are investing billions of dollars into AI infrastructure, driving demand for high-performance computing systems and specialized semiconductor chips.
Major technology firms are integrating AI into products ranging from search engines and virtual assistants to autonomous vehicles and enterprise software platforms. Because of this, investors increasingly view AI as one of the most important long-term growth trends in the global economy.
Industry developments and AI investment trends are frequently covered by technology news platforms such as:
https://www.bloomberg.com/technology
https://www.cnbc.com/technology/
https://techcrunch.com/
Even during periods of broader market weakness, AI-focused companies often receive strong investor support due to their strategic importance in the future digital economy.
Semiconductor Companies Remain at the Center of the AI Boom
Another segment of the technology sector attracting intense investor interest is the semiconductor industry. Semiconductor chips power everything from smartphones and computers to data centers, electric vehicles, and artificial intelligence systems.
The rapid expansion of AI technologies has created enormous demand for specialized chips designed for high-performance computing. Graphics processing units (GPUs), advanced processors, and AI accelerators are now essential components in modern data infrastructure.
Because of this, semiconductor companies have become critical players in the global technology supply chain.
Market analysts frequently track semiconductor stocks through industry indices and ETFs such as the Philadelphia Semiconductor Index. Performance data and market insights can be accessed through:
https://www.nasdaq.com/articles
https://www.marketwatch.com/tools/industry/semiconductors
https://www.investing.com/indices/philadelphia-semiconductor
Semiconductor firms often benefit from long-term structural demand trends, even when short-term economic conditions create volatility.
Earnings Reports and Industry Conferences Influence Sentiment
Investor sentiment toward technology stocks is also influenced by corporate earnings reports and industry conferences. During earnings season, major tech companies release financial results and provide forward-looking guidance about revenue growth, product demand, and capital spending plans.
Strong earnings results from major technology firms can help stabilize markets even during periods of macroeconomic uncertainty.
In addition to earnings reports, industry events such as technology conferences and developer summits often highlight new product launches, partnerships, and technological breakthroughs.
Announcements made during these conferences can influence investor expectations about the future growth of the technology sector.
Technology event coverage and earnings updates can be followed through sources such as:
https://www.reuters.com/technology/
https://www.cnbc.com/earnings/
https://www.nasdaq.com/articles/earnings
Balancing Short-Term Volatility with Long-Term Growth
The technology sector currently sits at the intersection of two powerful forces. On one hand, short-term macroeconomic factors such as inflation data and interest-rate expectations create volatility in growth stocks. On the other hand, long-term structural trends—including artificial intelligence, cloud computing, and semiconductor innovation—continue to drive investor interest.
This dynamic means that technology stocks may experience significant price swings in the near term while still maintaining strong long-term growth potential.
Professional investors often balance these competing forces by diversifying portfolios across multiple sectors, combining exposure to technology growth with defensive assets such as commodities, healthcare, or dividend-paying stocks.
What Investors Are Watching This Week
As markets await key economic data releases, several developments will be closely monitored:
• U.S. CPI inflation data and its impact on interest-rate expectations
• movements in Treasury yields and bond markets
• sector rotation between technology, energy, and defensive industries
• corporate earnings and guidance from major tech companies
• new developments in artificial intelligence and semiconductor demand
Financial news platforms such as
https://www.marketwatch.com/
https://www.investing.com/
https://www.bloomberg.com/markets
will continue to provide real-time updates as markets react to these developments.
If inflation surprises to the upside, technology stocks may face renewed pressure as bond yields rise. However, the powerful growth narrative surrounding artificial intelligence and semiconductor innovation means that investor interest in these sectors is likely to remain strong, even during periods of market volatility.
✈️ Consumer & Travel Stocks: Vulnerable
Higher energy costs can affect travel and consumer spending sectors.
Rising fuel prices increase airline operating costs and reduce disposable income for consumers.
This could lead to weakness in:
- Airline stocks
- Hospitality companies
- Retail chains
Higher energy costs can have a significant ripple effect across multiple sectors of the economy, particularly those that depend heavily on transportation and consumer spending. When fuel prices rise sharply—often due to geopolitical tensions, supply disruptions, or increased global demand—the impact extends far beyond the energy industry itself. Sectors such as aviation, tourism, hospitality, and retail frequently feel the pressure as operating expenses increase and consumers adjust their spending habits.
Energy markets are closely monitored by investors because oil prices influence inflation, transportation costs, and the broader economic outlook. Real-time updates on crude oil prices and energy market developments can be tracked through platforms such as:
https://www.investing.com/commodities/crude-oil
https://www.tradingview.com/markets/commodities/
https://www.reuters.com/markets/commodities/
When oil prices surge, the cost of producing refined fuels such as gasoline and jet fuel also rises. This creates a chain reaction across industries that rely heavily on energy for daily operations.
Rising Fuel Prices and the Airline Industry
One of the sectors most immediately affected by higher fuel costs is the airline industry. Airlines depend heavily on jet fuel, which is derived from crude oil. Fuel expenses typically represent one of the largest operating costs for airlines, often accounting for 20% to 30% of total operating expenses depending on market conditions.
When oil prices increase rapidly, airlines face a difficult choice: either absorb the higher fuel costs—reducing profit margins—or pass those costs on to consumers through higher ticket prices.
Financial analysts and aviation industry reports frequently track airline performance and cost structures through resources such as:
https://www.iata.org/en/publications/economics/
https://www.cnbc.com/airlines/
https://www.marketwatch.com/investing/industry/airlines
Higher ticket prices can discourage travel, particularly among price-sensitive consumers. Leisure travelers, who often book flights months in advance and compare prices across multiple airlines, may delay vacations or choose alternative travel options if airfare rises significantly.
Business travel, while generally less sensitive to price changes, can also decline if companies attempt to reduce expenses during periods of economic uncertainty.
As a result, airline stocks often react negatively when oil prices surge. Investors may anticipate lower profit margins and weaker demand, which can lead to selling pressure in aviation-related equities.
Fuel Costs and Airline Profitability
Airlines attempt to manage fuel price volatility through a variety of strategies, including fuel hedging. Fuel hedging involves purchasing fuel contracts in advance at predetermined prices to protect against sudden increases in oil costs.
However, hedging strategies are not always perfect. If oil prices rise faster than expected, airlines that are not fully hedged may experience significant cost increases. Conversely, if oil prices fall unexpectedly, companies with long-term hedging contracts may end up paying more than the market price for fuel.
This uncertainty makes airline stocks particularly sensitive to fluctuations in oil markets. Investors frequently track airline financial performance and industry outlooks through platforms such as:
https://www.bloomberg.com/markets
https://www.investing.com/analysis/stock-markets
Hospitality and Tourism Sector Pressure
Higher energy prices also affect the hospitality and tourism industries, which rely heavily on travel activity. Hotels, resorts, cruise lines, and tourism companies depend on a steady flow of travelers to maintain revenue growth.
When airfare rises due to higher fuel costs, travel demand can weaken. Tourists may postpone vacations, shorten trips, or choose destinations closer to home in order to reduce transportation expenses.
This shift in consumer behavior can reduce occupancy rates for hotels and resorts, especially in destinations that rely heavily on international tourism.
Industry data and tourism market analysis can be monitored through sources such as:
https://www.statista.com/topics/962/global-tourism/
https://www.unwto.org/tourism-data
Cruise operators are also affected by rising fuel costs because ships require large amounts of fuel for long-distance travel. Higher fuel expenses can increase operational costs and potentially reduce profitability if companies cannot fully pass those costs on to passengers.
Consumer Disposable Income and Spending
Another major impact of rising energy costs occurs at the household level. When fuel prices rise, consumers must allocate more of their income toward essential expenses such as gasoline, heating, and transportation.
This reduces disposable income, which is the money available for non-essential spending. As a result, consumers may cut back on discretionary purchases such as dining out, entertainment, travel, and retail shopping.
Retail sales data and consumer spending trends are closely monitored through economic reports and financial platforms such as:
https://www.census.gov/retail/
https://www.investing.com/economic-calendar/
If fuel prices remain elevated for an extended period, consumer confidence may also decline. Lower confidence levels often lead to more cautious spending behavior, which can negatively affect businesses that depend on discretionary consumer purchases.
Retail Chains and Consumer Spending
Retail companies are particularly vulnerable to shifts in consumer spending patterns. When households face higher transportation and energy costs, they may prioritize essential goods over discretionary items.
Retail sectors that often feel the impact include:
• clothing and fashion retailers
• electronics stores
• furniture retailers
• luxury goods companies
• department stores
Retail market performance and sector analysis can be followed through platforms such as:
https://finviz.com/groups.ashx
https://www.nasdaq.com/market-activity
Companies in these sectors may experience slower revenue growth if consumers reduce spending. Investors often react quickly to signs of weakening retail demand, which can lead to volatility in retail-related stocks.
Transportation and Logistics Costs
Higher fuel prices also increase costs for logistics and supply chain operations. Retailers and manufacturers rely on transportation networks to move goods from factories to warehouses and ultimately to stores or consumers.
When diesel prices rise, trucking companies and shipping firms face higher operating costs. These expenses may be passed along to retailers, increasing the cost of delivering products to market.
This dynamic can contribute to broader inflation pressures, as companies raise prices to offset higher transportation costs.
Logistics and freight market developments can be tracked through industry sources such as:
https://www.freightwaves.com/
https://www.transportation.gov/
Inflation and Broader Economic Impact
Rising energy prices also contribute to inflation, which can affect the entire economy. Energy costs are a major component of inflation indicators such as the Consumer Price Index (CPI).
When gasoline and fuel prices increase, the cost of goods and services across many sectors can rise as well. Central banks closely monitor these trends when making decisions about interest rates and monetary policy.
Inflation data and economic indicators are widely tracked through resources such as:
https://www.bls.gov/cpi/
https://www.forexfactory.com/calendar
If energy-driven inflation persists, central banks may maintain higher interest rates to prevent inflation from accelerating further. Higher interest rates can slow economic growth, which may place additional pressure on sectors already struggling with higher costs.
Sector Rotation During Energy Price Surges
During periods of rising oil prices, investors often shift capital away from sectors that are vulnerable to higher energy costs and toward industries that benefit from stronger commodity prices.
Energy companies involved in oil production, refining, and energy services may outperform the broader market during such periods.
Meanwhile, sectors that depend heavily on consumer spending and transportation—such as airlines, hospitality, and retail—may experience relative weakness.
Market sector performance can be visualized through tools such as:
https://finviz.com/map.ashx
https://www.tradingview.com/markets/stocks-usa/sector-and-industry/
What Investors Are Watching Next in the stock market
As energy prices continue to fluctuate, investors will be closely monitoring several key developments:
• movements in global crude oil prices
• airline fuel costs and ticket pricing trends
• consumer spending data and retail sales
• travel demand and tourism activity
• inflation indicators and central bank policy decisions
Financial news platforms such as:
https://www.cnbc.com/markets/
https://www.bloomberg.com/markets
provide ongoing coverage of these developments as they unfold.
If energy prices remain elevated, travel and consumer spending sectors could face continued pressure. Airline companies may struggle with rising fuel expenses, hospitality firms may experience slower booking activity, and retail chains may see reduced consumer demand. For investors, understanding these interconnected economic forces is essential when evaluating sector performance during periods of rising energy costs.
💱 Currency Markets and Stock Market Correlation
Currency markets are deeply interconnected with global stock markets, commodity prices, and geopolitical developments. When tensions rise in global politics—such as conflicts involving major oil-producing regions or disputes between large economic powers—investors often adjust their portfolios rapidly to protect capital. One of the most common responses during periods of uncertainty is a shift toward safe-haven currencies, which are currencies perceived as stable and reliable during economic or political turmoil.
Among the most prominent safe-haven currencies are the U.S. dollar (USD) and the Swiss franc (CHF). These currencies are widely used by global investors as defensive assets during times of market stress. Their strength often increases when geopolitical risks rise, financial markets become volatile, or investors lose confidence in riskier assets such as emerging-market stocks and currencies.
Financial markets and currency movements can be monitored through platforms such as:
https://www.investing.com/currencies/
https://www.tradingview.com/markets/currencies/
https://www.forexfactory.com/market
These resources provide real-time exchange rates, macroeconomic news, and analysis that help traders understand how currencies react to economic events.
Safe-Haven Currency Demand During Geopolitical Crises
When geopolitical tensions increase—such as military conflicts, trade disputes, or sanctions—investors typically seek assets that are considered relatively stable and liquid. The U.S. dollar and Swiss franc often benefit from this “flight to safety” behavior.
Several factors explain why these currencies attract capital during uncertain times:
- Economic stability – The United States and Switzerland have strong financial systems and stable political institutions.
- Large financial markets – U.S. Treasury markets provide investors with deep liquidity and relatively low risk.
- Global reserve status – The U.S. dollar serves as the world’s primary reserve currency.
Because of these characteristics, global investors frequently increase their holdings of dollar-denominated assets during crises.
Updates on currency market trends and geopolitical influences are widely covered by financial news outlets such as:
https://www.bloomberg.com/markets/currencies
https://www.cnbc.com/currencies/
https://www.reuters.com/markets/currencies/
Stronger Dollar and Its Impact on Multinational Companies
While a stronger U.S. dollar may reflect investor confidence in the American economy, it can create challenges for multinational corporations, particularly those that generate a large share of revenue overseas.
Many major U.S. companies—especially in sectors such as technology, consumer goods, and manufacturing—derive significant revenue from international markets. When the dollar strengthens relative to other currencies, foreign earnings translate into fewer dollars when companies convert overseas revenue back into U.S. currency.
For example, if a company earns revenue in euros or yen but reports financial results in dollars, a stronger dollar reduces the value of those earnings when converted. This can negatively affect reported revenue growth and profit margins.
Stock market data and corporate performance indicators can be monitored through platforms such as:
https://www.marketwatch.com/investing
https://finviz.com/
https://www.nasdaq.com/market-activity
Investors often pay close attention to currency headwinds during earnings season, particularly when large multinational corporations release financial results.
Export Competitiveness and Currency Strength
Another important consequence of a strong U.S. dollar is its impact on export competitiveness. When the dollar rises in value, American goods become more expensive for foreign buyers.
For example:
- A stronger dollar means international customers must pay more in their local currency to purchase U.S. products.
- This can reduce demand for American exports such as machinery, aircraft, agricultural goods, and technology equipment.
As a result, sectors heavily dependent on exports may face revenue pressure when the dollar appreciates significantly.
International trade data and export trends are frequently reported by organizations such as:
https://www.trade.gov/
https://www.worldbank.org/
https://www.wto.org/
These institutions provide insights into how currency fluctuations influence global trade flows.
Oil Prices and Emerging-Market Currency Pressure
While safe-haven currencies strengthen during geopolitical uncertainty, emerging-market currencies often move in the opposite direction. Many developing economies depend heavily on imported energy, and sharp increases in oil prices can create serious economic challenges.
When crude oil prices rise rapidly, countries that rely on oil imports must spend more foreign currency to purchase energy. This can weaken their currencies and increase pressure on their trade balances.
Commodity price movements can be tracked through:
https://www.investing.com/commodities/crude-oil
https://www.eia.gov/
https://www.opec.org/
Higher energy costs can also contribute to inflation in emerging economies, which may force central banks in those countries to raise interest rates in order to stabilize their currencies.
Capital Flows and Emerging Markets
Another factor influencing emerging-market currencies during periods of rising oil prices is capital flow dynamics. When global investors become risk-averse, they often withdraw funds from developing markets and shift capital into safer assets such as U.S. Treasury bonds or developed-market equities.
This process can lead to:
- currency depreciation
- higher borrowing costs
- stock market volatility in emerging economies
Global capital flow trends and emerging-market financial conditions are regularly analyzed by institutions such as:
https://www.imf.org/
https://www.bis.org/
https://www.worldbank.org/en/topic/financialmarkets
These organizations monitor financial stability and economic risks across developing countries.
Oil Exporters vs Oil Importers
It is important to note that rising oil prices do not affect all emerging economies equally. Countries that export oil, such as Brazil, Saudi Arabia, or Nigeria, may actually benefit from higher crude prices because energy exports generate additional revenue.
However, oil-importing nations, particularly in Asia and parts of Africa, may face economic strain when fuel costs increase significantly.
Higher energy prices can weaken national currencies by increasing trade deficits and reducing economic growth prospects.
Currency Markets and Global Stock Performance
Currency movements often influence global stock market performance. When the U.S. dollar strengthens significantly, international investors may reduce exposure to foreign equities and redirect funds toward U.S. financial markets.
Conversely, a weaker dollar can sometimes support global stock markets by making international assets more attractive.
Currency fluctuations can also affect commodity prices. Because commodities such as oil and gold are typically priced in dollars, a stronger dollar often puts downward pressure on commodity prices—although geopolitical events can sometimes override this relationship.
What Investors Are Watching Now
As geopolitical tensions continue to influence financial markets, investors are paying close attention to several key developments:
• movements in the U.S. dollar and Swiss franc
• global oil price trends
• capital flows into safe-haven assets
• currency stability in emerging markets
• central bank responses to inflation and economic risk
Financial market data and macroeconomic analysis can be followed through:
https://www.forexfactory.com/
https://www.investing.com/
https://www.tradingview.com/
These platforms provide real-time updates on currency movements, economic indicators, and geopolitical developments that influence global markets.
The Bigger Picture for Global Investors
Currency markets play a critical role in shaping global investment strategies. When geopolitical tensions rise and oil prices surge, capital often moves quickly toward safer currencies and away from riskier markets.
This shift can strengthen the U.S. dollar and Swiss franc while placing pressure on multinational corporations and emerging-market currencies. For investors, understanding the relationship between currency markets, commodity prices, and global stock performance is essential when navigating periods of financial uncertainty.
🧠 Technical Stock Market Signals
From a technical perspective, several signals suggest markets may remain volatile this week.
Key Levels to Watch
S&P 500
- Support: 4,850
- Resistance: 5,050
Nasdaq
- Support: 15,800
- Resistance: 16,300
Dow Jones
- Support: 38,000
- Resistance: 39,200
If geopolitical tensions escalate further, markets may test lower support levels before stabilizing.
From a technical analysis perspective, several indicators suggest that financial markets could remain volatile throughout the week, particularly as traders digest geopolitical developments, energy price movements, and key economic data releases. Technical analysis focuses on price charts, historical patterns, and key support and resistance levels to identify potential market turning points. When markets approach these important levels, investors often watch closely for breakouts or reversals that could signal the next major trend.
Professional traders and analysts frequently rely on charting tools and technical indicators available on platforms such as:
https://www.tradingview.com/markets/stocks-usa/
https://finviz.com/
https://www.investing.com/indices/
These platforms provide real-time market charts, technical indicators, and heat maps that help investors monitor price action across major global indices.
This week, the three major U.S. stock indices—the S&P 500, Nasdaq Composite, and Dow Jones Industrial Average—are trading near important technical zones that could determine the short-term direction of the market.
Understanding Support and Resistance Levels
Before examining the specific index levels, it is important to understand what support and resistance represent in technical analysis.
Support is a price level where buying interest tends to emerge, preventing prices from falling further. Traders often view support as a potential entry point because markets historically bounce from these levels.
Resistance, on the other hand, is a price level where selling pressure tends to increase. When prices approach resistance zones, investors may begin taking profits, which can slow or reverse upward momentum.
When markets break through these levels decisively, they often trigger increased volatility as traders reposition their portfolios.
Technical analysis concepts and chart patterns are widely explained through educational resources such as:
https://www.investopedia.com/terms/t/technicalanalysis.asp
https://www.babypips.com/learn/forex/technical-analysis
S&P 500 Technical Outlook
The S&P 500, widely regarded as the benchmark index for the U.S. equity market, is currently trading within a critical technical range. The index tracks the performance of 500 large publicly traded companies across multiple sectors, making it a key indicator of overall market sentiment.
Key Levels to Watch
Support: 4,850
Resistance: 5,050
Market data and technical charts for the S&P 500 can be monitored through:
https://www.investing.com/indices/us-spx-500
https://www.tradingview.com/symbols/SPX/
If the index holds above the 4,850 support level, it may indicate that buyers remain active and that the broader bullish trend could continue. Institutional investors often step in near strong support zones, particularly when macroeconomic conditions remain relatively stable.
However, if geopolitical tensions or inflation data trigger increased selling pressure, a break below 4,850 could lead to a deeper correction as stop-loss orders and algorithmic trading systems accelerate downward momentum.
On the upside, the 5,050 resistance level represents a major psychological barrier. A sustained breakout above this level could signal renewed bullish momentum and potentially open the door for further gains toward new record highs.
Nasdaq Composite Technical Outlook
The Nasdaq Composite Index has been one of the most closely watched indices in recent years because of its heavy concentration of technology companies, including major firms involved in artificial intelligence, cloud computing, and semiconductor manufacturing.
Technology stocks often drive broader market trends due to their large market capitalizations and influence on investor sentiment.
Real-time Nasdaq market data and technical charts are available at:
https://www.nasdaq.com/market-activity/indexes/comp
https://www.tradingview.com/symbols/NASDAQ-IXIC/
Key Levels to Watch
Support: 15,800
Resistance: 16,300
The 15,800 level currently represents a strong technical support zone where buyers have previously stepped in during recent market pullbacks.
If the Nasdaq falls below this support level, the decline could accelerate as traders reassess valuations for technology companies, particularly if interest rates remain elevated.
Higher interest rates tend to pressure technology stocks because many of these companies rely on future earnings growth. When borrowing costs rise, valuations for growth stocks often decline.
Conversely, a breakout above the 16,300 resistance level could indicate renewed investor confidence in the technology sector. Strong earnings reports, positive developments in artificial intelligence, or cooling inflation data could help push the index toward higher levels.
Technology sector developments are frequently analyzed through financial news platforms such as:
https://www.bloomberg.com/technology
https://www.cnbc.com/technology/
Dow Jones Industrial Average Outlook
The Dow Jones Industrial Average (DJIA) represents a different segment of the market compared to the Nasdaq. The Dow tracks 30 large blue-chip companies across industries such as finance, manufacturing, healthcare, and consumer goods.
Because of its composition, the Dow is often considered a barometer for the traditional industrial economy rather than the technology-driven growth sector.
Dow Jones index data and technical charts can be tracked through:
https://www.marketwatch.com/investing/index/djia
https://www.investing.com/indices/us-30
Key Levels to Watch
Support: 38,000
Resistance: 39,200
The 38,000 level represents an important support zone that has held during recent market fluctuations. If this level remains intact, it could signal that investors continue to view blue-chip companies as relatively stable investments during uncertain economic conditions.
However, a breakdown below this level could trigger broader market concerns, particularly if geopolitical tensions or rising energy prices begin to affect corporate earnings expectations.
On the upside, the 39,200 resistance level represents a key hurdle for bullish momentum. A successful breakout above this level could indicate renewed confidence in the economic outlook and potentially drive the Dow toward new highs.
S&P 500 – Key Technical Levels
Support: 4,850
Resistance: 5,050

4
The S&P 500 is widely considered the benchmark for the U.S. equity market, representing 500 of the largest publicly traded companies. From a technical perspective, the 4,850 level represents an important support zone, where institutional buyers have previously stepped in to stabilize market declines.
If the index approaches this level again, traders will watch closely for signs of buying pressure or a bounce, which could signal that bullish sentiment remains intact.
However, if selling pressure intensifies—possibly due to rising geopolitical risks or inflation data surprises—the index could break below this level. A breakdown under support often triggers algorithmic trading and stop-loss orders, which can accelerate downside volatility.
On the upside, the 5,050 level acts as a key resistance zone. This area represents a price level where sellers previously emerged to take profits. If the S&P 500 manages to break above this level with strong volume, it could signal renewed bullish momentum and open the path toward new highs.
You can monitor the S&P 500 chart and technical indicators here:
https://www.tradingview.com/symbols/SPX/
https://www.investing.com/indices/us-spx-500
Nasdaq Composite – Key Technical Levels
Support: 15,800
Resistance: 16,300

4
The Nasdaq Composite remains one of the most closely watched indices because it is heavily weighted toward technology companies. Major firms involved in artificial intelligence, cloud computing, and semiconductors play a significant role in the index’s performance.
The 15,800 support level represents an important technical floor where buyers previously defended the market. If the index declines toward this level again, traders will watch for confirmation signals such as:
- bullish candlestick patterns
- increased buying volume
- momentum indicators turning upward
If the support level fails, the Nasdaq could enter a deeper correction, particularly if interest rates rise or technology valuations come under pressure.
Meanwhile, the 16,300 resistance level marks a key barrier for bullish momentum. A breakout above this level could indicate strong investor demand for technology stocks and renewed confidence in sectors driving innovation, particularly AI and semiconductor companies.
Technology sector news and Nasdaq market performance can be tracked through:
https://www.nasdaq.com/market-activity
https://www.bloomberg.com/technology
https://www.cnbc.com/technology/
Dow Jones Industrial Average – Key Technical Levels
Support: 38,000
Resistance: 39,200

4
The Dow Jones Industrial Average (DJIA) represents 30 major blue-chip companies across industries such as manufacturing, healthcare, finance, and consumer goods. Because of its composition, the Dow often reflects the health of the traditional industrial economy rather than high-growth technology sectors.
The 38,000 level currently serves as a major support zone. If the Dow approaches this level during market volatility, traders will watch closely for institutional buying activity.
Holding above this level could signal that investors still view blue-chip companies as relatively stable investments during uncertain economic conditions.
However, if the index falls below 38,000, it may indicate broader market risk aversion, particularly if geopolitical tensions escalate or economic data disappoints.
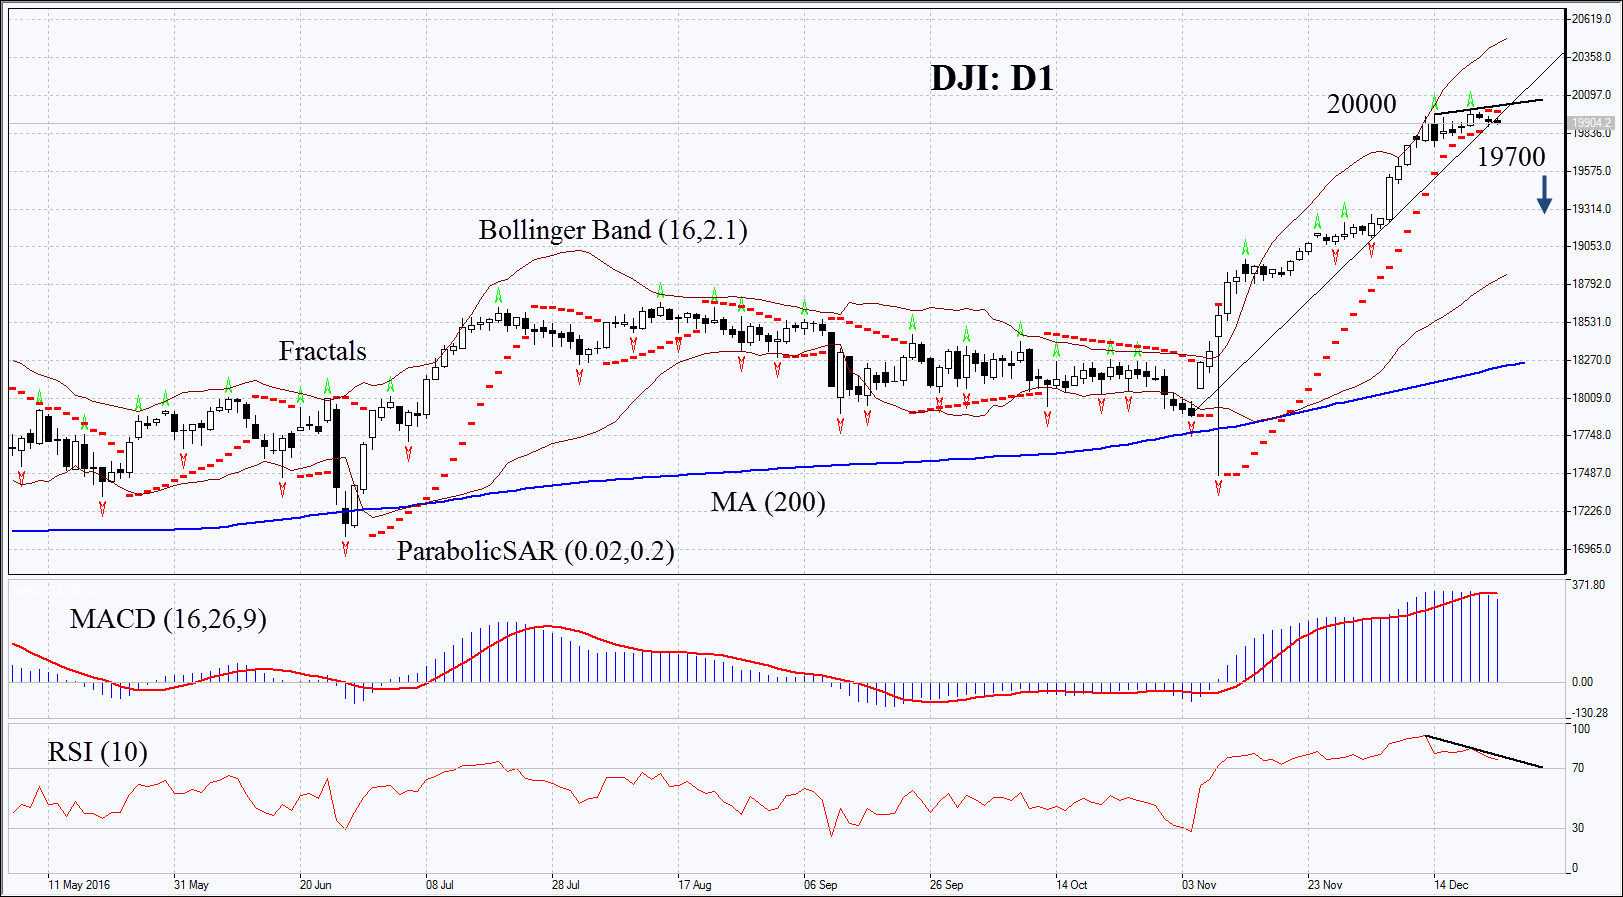
On the upside, the 39,200 resistance level represents a critical hurdle for bullish momentum. A sustained breakout above this level could trigger a new rally as traders interpret the move as confirmation that market sentiment remains strong.
Dow Jones index performance can be monitored through:
https://www.marketwatch.com/investing/index/djia
https://www.investing.com/indices/us-30
https://finviz.com/
Why These Levels Matter for Traders
Support and resistance levels are among the most widely used tools in technical analysis because they reflect collective investor behavior.
Key reasons traders focus on these levels include:
• identifying potential entry and exit points
• managing risk through stop-loss orders
• spotting breakouts or trend reversals
• confirming market momentum
During periods of geopolitical uncertainty—such as rising oil prices or global conflicts—markets often test these technical levels as investors reassess risk exposure.
You can follow real-time market data and technical analysis through:
https://www.tradingview.com/
https://www.forexfactory.com/
https://www.investing.com/analysis/
✅ Summary
The key technical levels to watch this week are:
| Index | Support | Resistance |
|---|---|---|
| S&P 500 | 4,850 | 5,050 |
| Nasdaq | 15,800 | 16,300 |
| Dow Jones | 38,000 | 39,200 |
If geopolitical tensions escalate or economic data surprises markets, indices could retest support levels before stabilizing. Conversely, positive news or easing tensions could push markets toward resistance zones and potential breakouts.
Geopolitical Tensions and Market Volatility
Technical levels do not operate in isolation. Market movements are often influenced by macroeconomic events and geopolitical developments.
Recent tensions in the Middle East, rising oil prices, and concerns about global supply chains have created additional uncertainty for investors. Energy market developments can be tracked through:
https://www.eia.gov/
https://www.opec.org/
https://www.investing.com/commodities/crude-oil
If geopolitical tensions escalate further, financial markets could experience increased volatility as investors move capital into safer assets such as gold, government bonds, and defensive sectors.
During periods of uncertainty, traders often adopt a risk-off strategy, reducing exposure to equities and shifting funds into assets perceived as safer.
Gold prices and safe-haven asset movements can be monitored through:
https://www.investing.com/commodities/gold
https://www.kitco.com/
Market Psychology and Technical Reactions
Technical analysis is closely linked to investor psychology. Support and resistance levels often become self-reinforcing because large numbers of traders place orders around these zones.
For example:
- Buyers may enter the market near support levels.
- Sellers may take profits near resistance zones.
- Stop-loss orders may trigger rapid price movements if support breaks.
Because many institutional investors use similar technical indicators, price reactions near these levels can sometimes produce sharp and sudden market moves.
What Traders Are Watching This Week
As markets navigate a complex environment of economic data releases and geopolitical uncertainty, traders will focus on several key indicators:
• whether major indices hold above critical support levels
• potential breakouts above resistance zones
• movements in oil prices and energy markets
• interest-rate expectations following inflation data
• investor sentiment toward technology and growth stocks
Market news and technical analysis updates can be followed through:
https://www.forexfactory.com/
https://www.tradingview.com/
https://www.investing.com/analysis/
Final Market Outlook
Overall, the technical outlook suggests that volatility may remain elevated this week. Markets are currently positioned near critical technical levels, and external factors such as geopolitical tensions, energy price movements, and economic data releases could determine the next major trend.
If geopolitical tensions escalate further, markets may test lower support levels before stabilizing. However, if tensions ease and economic data comes in stronger than expected, equities could regain momentum and attempt to break above key resistance levels.
For investors and traders alike, monitoring both technical indicators and macroeconomic developments will be essential in navigating the week ahead.
📊 Investor Sentiment & Market Psychology
Investor psychology plays a major role during geopolitical crises.
When uncertainty rises:
- Investors reduce exposure to risky assets
- Capital flows into commodities like gold and oil
- Government bonds attract safe-haven demand
This pattern is already visible as market volatility increases and the VIX index rises sharply, signaling higher levels of fear in financial markets.
📈 What Investors Should Watch This Week
The most important factors likely to influence markets between March 9 and March 15 include:
1️⃣ Oil Price Movements
Oil remains the dominant driver of global risk sentiment.
2️⃣ Inflation Data
CPI results will shape expectations for Federal Reserve policy.
3️⃣ Geopolitical Developments
Any change in the Iran conflict could trigger rapid market moves.
4️⃣ Treasury Yields
Bond yields reflect expectations for economic growth and inflation.
5️⃣ Corporate Earnings Updates
Technology and energy companies could drive sector rotation.
📉 Risks to the Market
Several downside risks remain:
- Escalation of the Middle East conflict
- Sustained oil prices above $100
- Higher inflation delaying central-bank rate cuts
- Weak consumer spending indicators
Each of these could amplify volatility across global stock markets.
📊 Final Market Outlook (March 9–15)
The upcoming week is shaping up to be one of the most volatile trading periods of early 2026.
Energy markets, geopolitical developments, and inflation data are combining to create a complex environment for investors.
Bullish Factors
- Strong energy sector performance
- Possible diplomatic de-escalation in the Middle East
- Continued demand for AI-related technology stocks
Bearish Factors
- Persistent oil shock
- Inflation risks
- Rising geopolitical tensions
🧠 Bottom Line
The weekly stock market outlook for March 9–15, 2026 suggests markets will likely trade cautiously as investors digest rising energy prices and key economic data.
Oil, inflation, and geopolitics are currently the dominant themes shaping global financial markets.
Traders should closely monitor energy markets, inflation reports, and geopolitical headlines, as any new development could quickly shift market momentum.
Oil Shock Fears Rock Global Markets as Trump-Iran Crisis Escalates — Stocks, Gold and Forex React
Elon Musk News Today: Tesla Legal Risk, X Money, and Platform Changes Could Move Global Markets
Trump News Today (March 6, 2026): Oil Shock, Tariffs, and War Risks Shake Global Markets